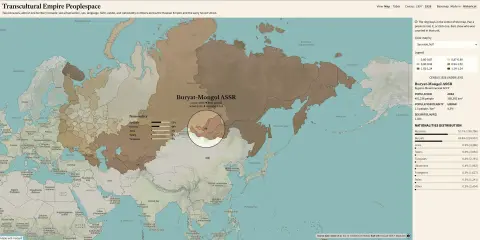
Visualization "Transcultural Empire Peoplespace"

Interactive explorer of the 1897 and 1926 censuses on a shared historical map

From Russian Empire subjects to Soviet citizens. Maps and tables for the 1897 and 1926 censuses, showing how population and census categories changed between the two regimes.
read →

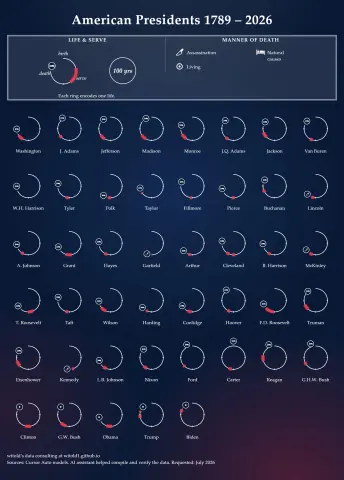
Visualization "American Presidents - Lifetimes & Service"

Circular lifetime glyphs for U.S. presidents life arcs

An interactive recreation of the Roman Emperors circular lifetime chart applied to U.S. presidents. Lifespan arcs, terms in office, and manner of death, built so the same approach can scale to other historical periods.

read →

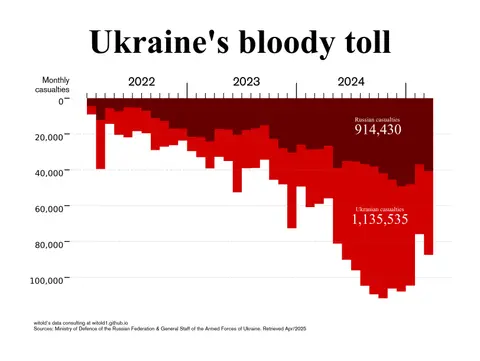
Visualization "Ukraine's bloody tool"

Daily casualty estimates reported by each belligerent party for the opposing side since February 2022

This work illustrates cross-reported casualty estimates from the daily briefings of the respective military authorities, with each side reporting estimates of the other’s casualties. It also discusses the methodology and limitations of the reported data.

read →

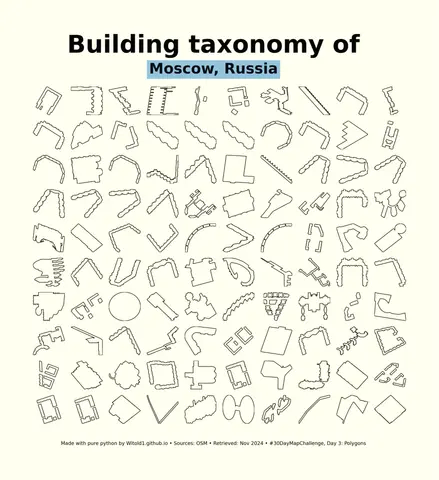
Visualization "Building taxonomy"

Simplified building taxonomy of selected cities

A minimalist small-multiple grid of the 100 most geometrically complex buildings in each city, computed from OpenStreetMap building geometries.

read →

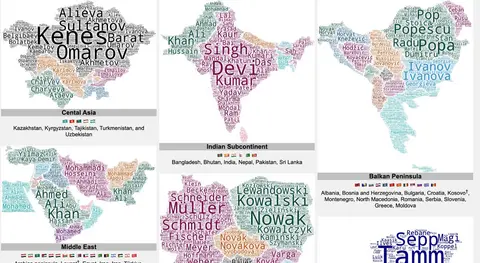
Forenames of the World

Meta page for regional surname wordcloud posts

This post experiments with the most common forenames across the world through wordcloud visualisation.

read →

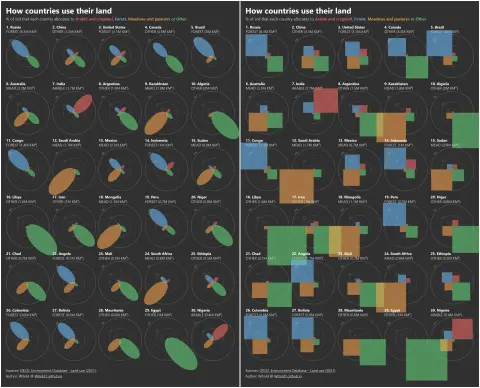
Visualization "How Countries Use Their Land"

Small-multiple petal chart of OECD land-use shares for the largest countries

A artistic work to show shares of arable, forest, meadows and pastures, and other land uses. Jupyter Notebook poster plus an interactive browser tool.

read →