How largest countries use their land (light petals / dark squares)
What is this about?
#30DayChartChallenge | OECD Data Day
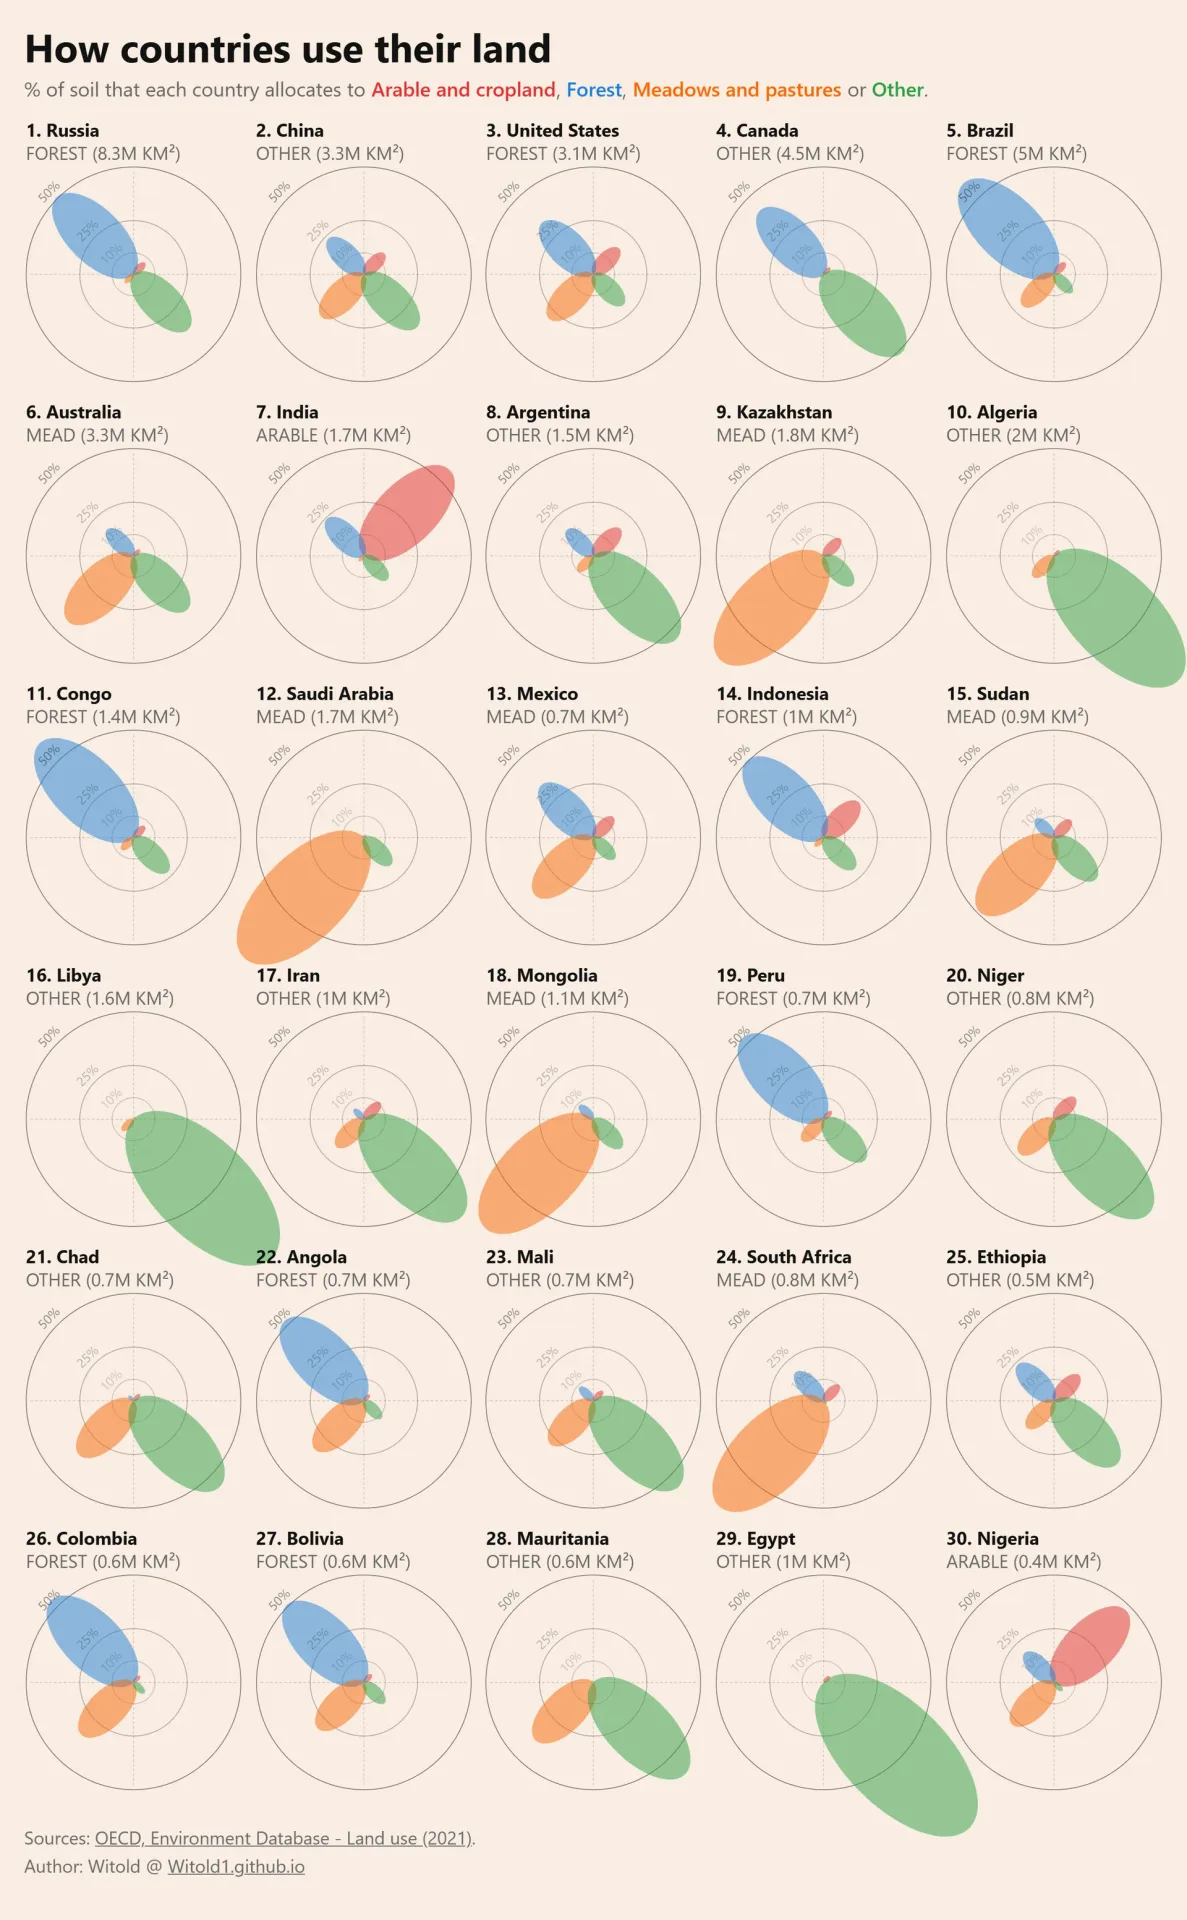
Recently I saw a wonderful #30DayChartChallenge OECD (Data Day) visualization of land use patterns by country, made by Mireia Camacho. I liked it a lot, so I decided to reproduce it with Python and slightly make it out.
As usual, pure #python and #matplotlib were used. Chart type is unusual: semantically it resembles a mix of pie chart and bar chart, but most people call it a petal, or polygonic petal, chart. Still, here is a small multiple with such petal sub-charts.
What changes have I made?
- Firstly, I "zoomed" observations in, following their distribution. Why? Because the sum of shares in each chart can't exceed 100%, most observations lie below the 50-60% level. Thus, I felt an axes range from 0% to 100% was redundant, because it defocused the viewpoint from actual data points to empty spaces.
- Secondly, I sorted sub-charts by total area of countries. It allows an additional hidden dimension, because percentages of area are relative numbers that can be tricky if viewers would like to compare countries. Some 10% of China's land may exceed some 50% of Thailand's land.
- Thirdly, I added annotation of "land use specialization", or the biggest petal, to sub-charts. It should enrich previous points and allow more freedom for cross-country comparison.
- The last but quite important, I added enumeration to sub-charts to retrieve information faster.
What else could we work on?
- More attention to dynamics. Some observations, with no regard to quality, are available decades in advance. We better get some questions stated, but even from such a general prism, between 1992 (random point) and 2021 (most recent available), we could see huge deforestation in Brazil, Indonesia, Congo, Peru, and many other countries.
- Practices of accessibility. Under a full gray filter, colored elements of the sub-chart are not contrast enough, so we could add more accessibility-friendly methods not to rely on colors (for example, either patterns and dash styles to petals or an additional legend with location of petals).
Made with #Python + #matplotlib
Data: OECD land use
#dataviz #datavisualization
How to read this?
Each repetative "block" is one country. Countries are placed in "small multiple" grid and ordered by their total land area. Four "petals" show land use types reported by Organization for Economic Co-operation and Development (OECD) and Food and Agriculture Organization of the U.N. (FAO). Petal length is that category’s percent share. Rings show the 10%, 25%, and 50% guides so chart can be read easier. Subtitle under each country name shows the exact area of largest category.
The underlying numbers come from OECD land-use statistics (built on FAO land-cover measures): for each country, the four category shares are percentages of that country’s land, so the petals are comparable as composition rather than as absolute area. Absolute km² in the subtitle is derived from those shares and total land area, which is why sorting countries by total area still matters when reading across the small multiples.
What's under the hood?
Open the interactive web tool. See the source code now on GitHub and see refactored notebook on nbviewer.
Related work
This work was inspired by #30DayChartChallenge OECD land-use visualization by Mireia Camacho. At the same time, "flower"-like visual language of circular charts and non-traditional bar charts are very common. You can check Sports City by Matt Chambers, Petals And Circles Don’t Always Make Wreaths by CJ Mayes (archived), The Freedom of Expression by Nadieh Bremer.
Media presence
How to cite
For human-readable attribution, please cite this work as:
Visualization "How Countries Use Their Land" (2024), Vitaliy Yevtushenko (Witold's Data Consulting). https://witold1.github.io/portfolio/blog/viz-petal-land-use-chart/.BibTeX
@misc{witold_blog_viz-petal-land-use-chart,
  author = {Vitaliy Yevtushenko},
  title = {{Visualization "How Countries Use Their Land"}},
  year = {2024},
  url = {https://witold1.github.io/portfolio/blog/viz-petal-land-use-chart/},
}