Table of contents
There's only one truth about war: people die. Killing is part of a soldier's job. We can't deny it. We can only live with it and hope the reasons for doing it are justified (c) Commander John Sheridan
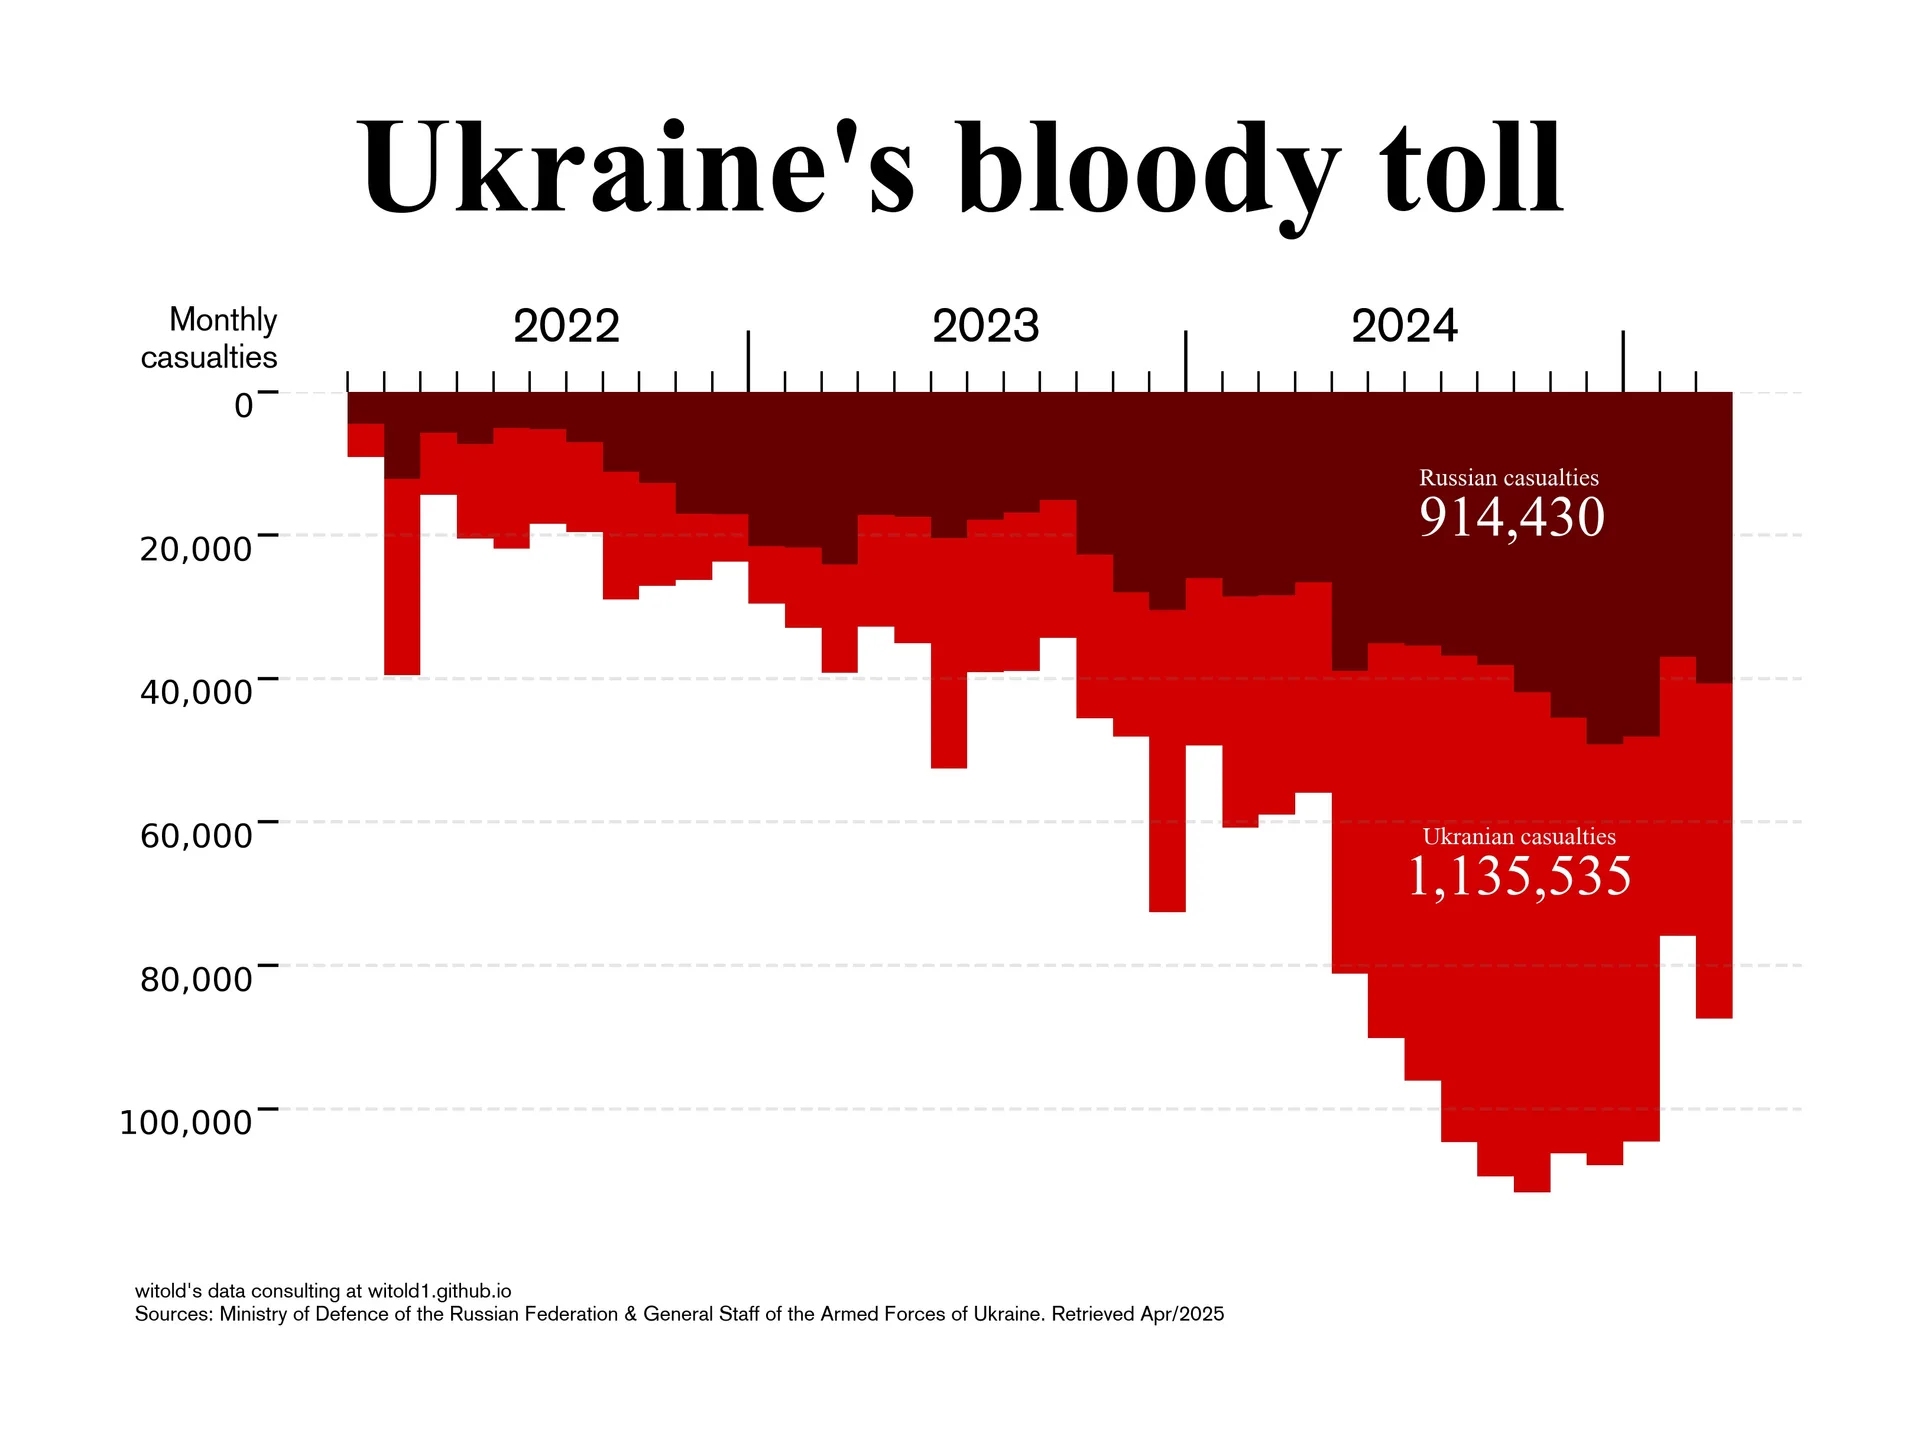
Aggregated monthly casualty estimates officially reported by each belligerent party for the opposing side since February 2022
What's this about?
What casualty figures did each side officially report for the opposing side, day by day? The ground truth on casualty figures, including the death toll, remains unknown. A wide range of journalists and researchers have attempted to estimate military casualties using various methodologies, including open-source analysis, social media analysis, demographic analysis, event-based data collection, intelligence assessments, and statistical modelling. These approaches provide important estimates, but they necessarily rely on assumptions, data sources, and methodological choices that remain subject to debate and revision as new evidence becomes available.
This work takes a slightly different approach. Rather than attempting to estimate the ground truth, we collected and visualized cross-reported casualty figures from the daily briefings of the respective military authorities, with each side reporting estimates of the other side's casualties. The data were collected using PyData, Selenium, and Beautiful Soup, with experiments in LLM-assisted information extraction.
The methodology and terminology used here are intentionally descriptive and do not adopt either party's official characterization of the conflict. The resulting dataset provides a consistent visual record of the casualty figures reported by the belligerent parties over time.
Notes on method and interpretation
-
These are casualties, not fatalities. Do not treat casualty figures as fatalities. The term casualty can include killed, wounded, captured, missing, and other categories of personnel lost or affected, depending on the reporting system. The same individual may potentially be counted more than once over time, depending on how casualties are recorded and reported. In practice, officers are often responsible for recording casualties that occurred within their commandsref 1. Definitions and counting practices may differ between the parties and may also change over the course of the conflictref 2. Converting casualties into fatalities by applying a "wounded-to-killed ratio" requires assumptions about the composition of the reported figures, definitions, medical outcomes, reporting practices, and the underlying population. Different ratios can therefore produce substantially different results. Such calculations are outside the scope of this project.
-
These are cross-reported figures. Each side reports estimates of the other side's casualties. The figures therefore represent official wartime claims, not independently verified measurements of ground truth.
What’s important to understand before reading the numbers?
These figures are best understood as officially reported claims rather than ground truth. Many journalists and researchers have attempted to estimate military casualties using alternative sources and methodologies, including open-source documentation, social media analysis, demographic analysis, event-based data collection, intelligence assessments, satellite imagery, and statistical modelling. These approaches may provide useful estimates, but they rely on different assumptions, sources, and methodological choices, and their results remain subject to debate and revision as new evidence becomes available.
Comparable independent estimates for both sides remain difficult to establish. The parties to a conflict also have strategic incentives regarding what casualty information they disclose and how they characterize the opposing side's losses.
This project does not attempt to resolve these uncertainties. The two sides' figures are collected using the same general procedure and presented alongside each other, but this does not imply that they are equally accurate, equally reliable, or equally close to the ground truth. The purpose is to provide a consistent visual record of what the respective military authorities officially reported over time.
- Future evidence may change the picture. Independent research, newly available records, archival material, demographic data, and other sources may eventually allow these wartime claims to be assessed more reliably. This dataset is intended to preserve the reported figures so that they can also be compared with future evidence.
Sources and data access (legacy summary)
- Aggregated secondary tables (claimed to be based on official briefings):
minfin.com.uamskvremya.ru
- Examples of primary sources:
- Russian MoD briefing example:
https://briefing-mo.ru/... - Ukrainian operational update example:
https://www.zsu.gov.ua/...
- Russian MoD briefing example:
Dataset:
Inspiration:
Media presence
No external mentions listed.
How to cite this work
For human-readable attribution, please cite this work as:
Visualization "Ukraine's bloody tool" (2025), Vitaliy Yevtushenko (Witold's Data Consulting). https://witold1.github.io/portfolio/blog/viz-ukraines-bloody-tool/.BibTeX
@misc{witold_blog_viz-ukraines-bloody-tool,
  author = {Vitaliy Yevtushenko},
  title = {{Visualization "Ukraine's bloody tool"}},
  year = {2025},
  url = {https://witold1.github.io/portfolio/blog/viz-ukraines-bloody-tool/},
}