Table of contents
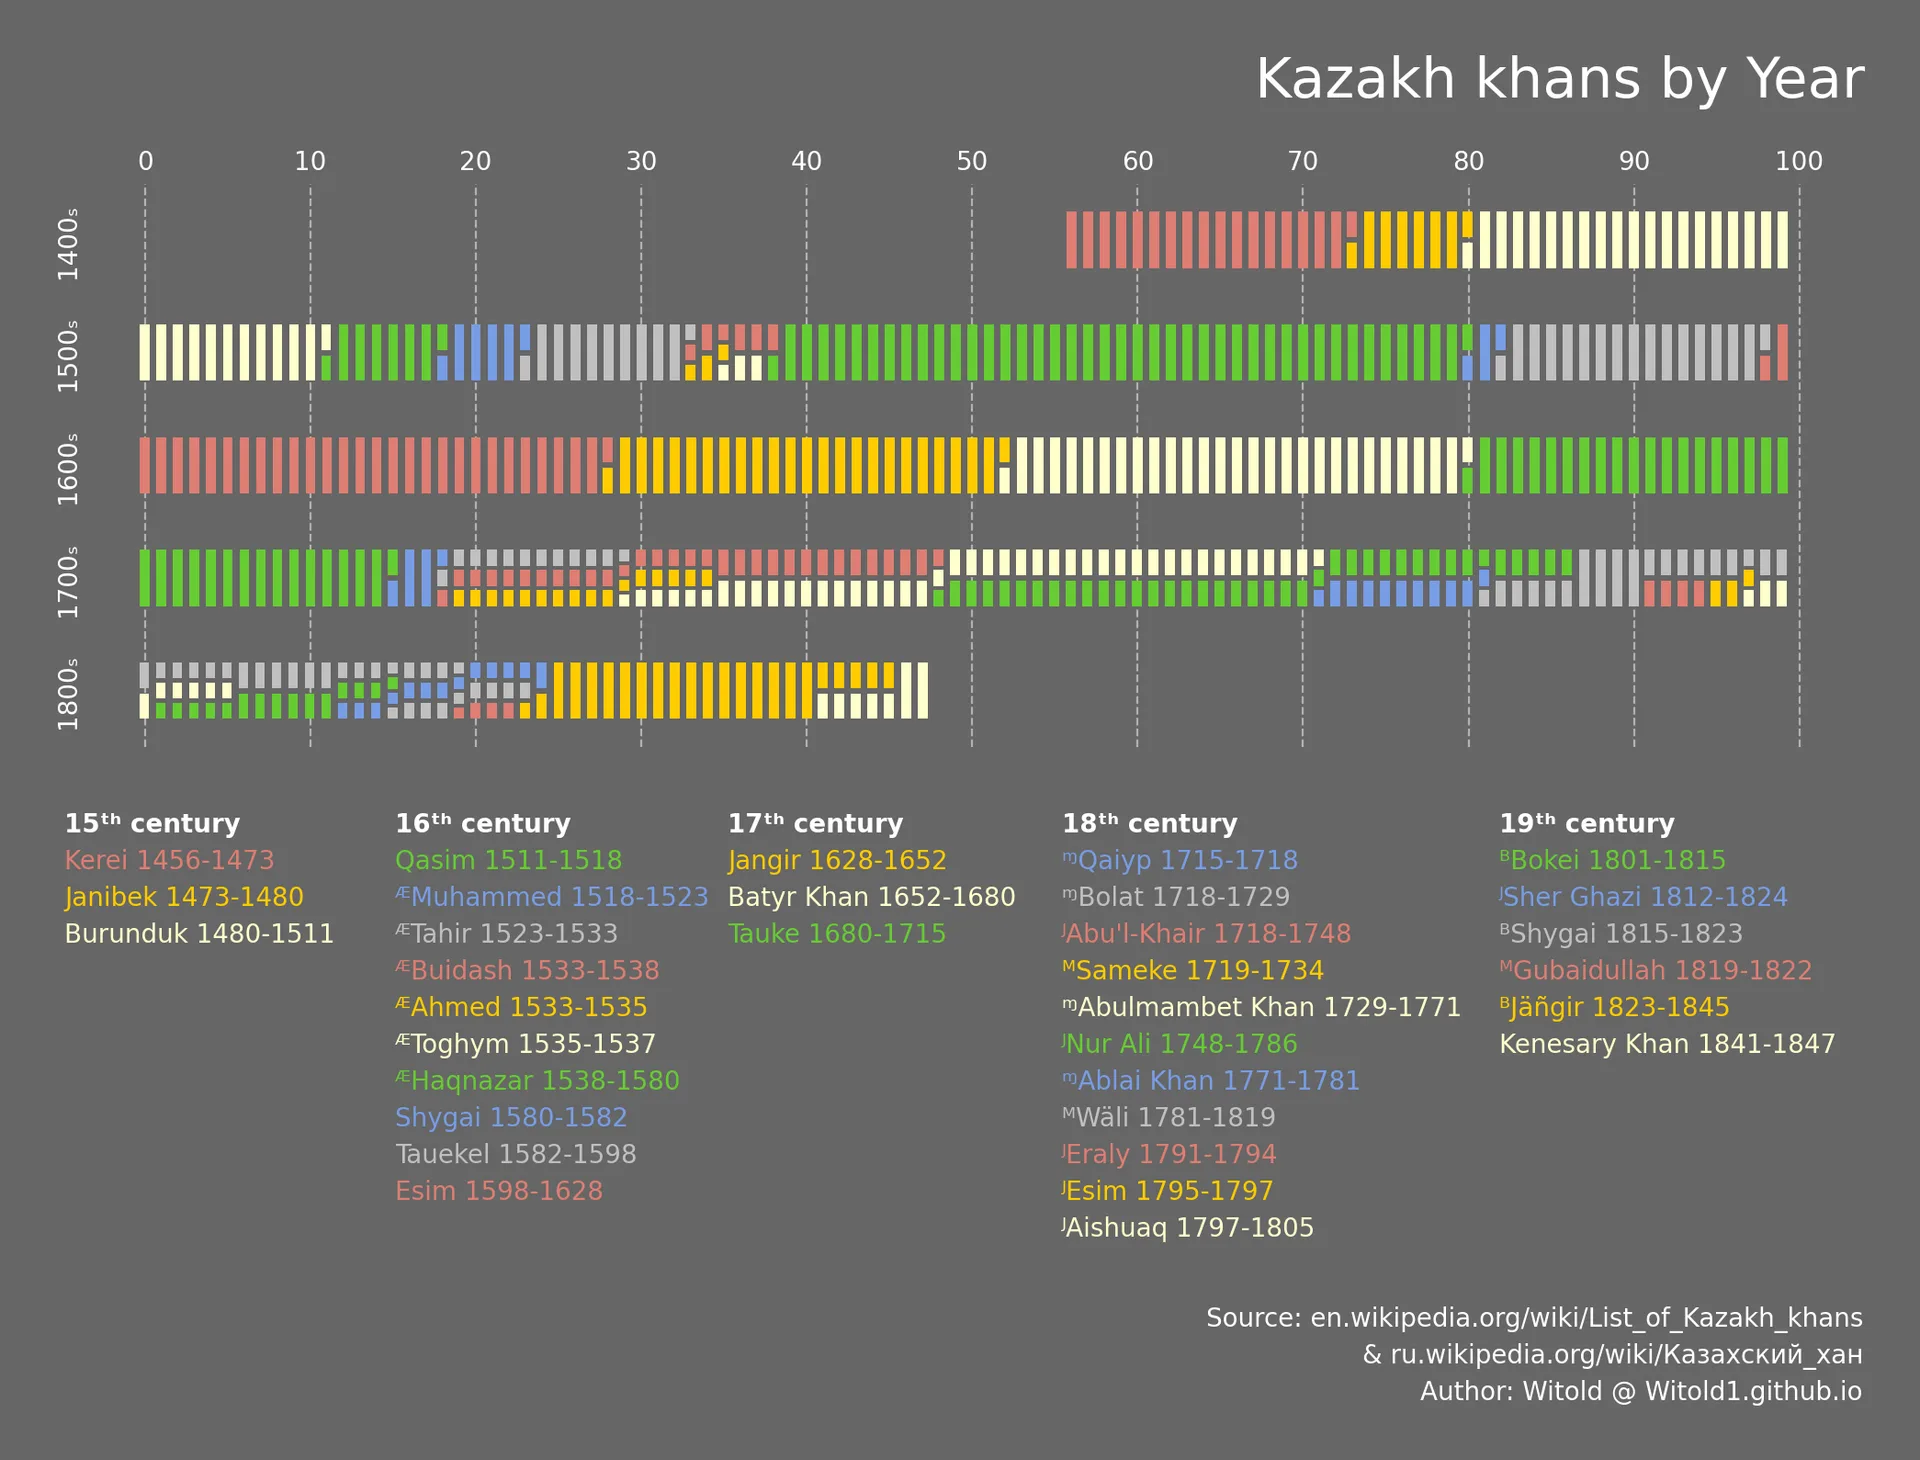
Rulers of Kazakh Khanate visualization in dark and light color palette
What is this about?
I recently came across an old infographic about Roman emperors, prepared by Peter Gorman from BarelyMaps for the #dataisbeautiful contest on Reddit. That work combines artistic and analytical approaches to visualize complex political dynamics over long periods of time.
I wanted to see what the same visual language would look like when applied to other periods, and first picked the Kazakh Khanate - one of the historical successor states (khanate, nomadic polity) of the Golden Horde that existed in the region of modern-day Central Asia. You can learn more about this polity in History of Kazakh Khanate (animated map) from Anwoo Mapping History.
How to read this?
I'm not entirely sure whether "stripe chart" is the established name for this visualization type, but the idea is fairly simple.
Each stripe represents one year within a given century. A solid stripe means that there was a single ruler during that year, suggesting a period of relative stability. A segmented stripe means that multiple rulers reigned during the same year. This usually indicates some form of political instability or a power vacuum - for example, a succession dispute, divided major authority or co-rule, unrest, civil war, or other forms of conflict.
The table below acts as a legend: each ruler has their own color, allowing the stripes to be matched to their respective names and years of reign. One caveat: the color palette is not designed to be web-safe or grayscale-safe.
Why did I make it?
I wanted to reproduce the original chart using pure Python and Matplotlib. Another goal was to make this visual approach more reusable and test it with different historical periods, since original work was reportedly created with Illustrator.
What's under the hood?
A couple of years later, I published a refactored version of the project's code (refactored with an LLM) and built a web tool that can generate similar charts for other historical periods. There are currently multiple historical dataset available as presets that I gathered with AI agents, including the original Roman Emperors, Middle Eastern Caliphs, and English Kings. I also generated a synthetic example dataset designed to test more complex situations, including text encoding, multiple co-rulers, multiple power vacuums, epochs, and epoch splits. Open the interactive web tool. See the source code now on GitHub.
Related work
This is a pretty unusuas way to show a timeline, but for futher and interactive inspiration you can also check Bartosz Ciołek's work in English Kingdom.
Media presence
How to cite
For human-readable attribution, please cite this work as:
Visualization "Rulers of the World" - Kazakh Khanate (2024), Vitaliy Yevtushenko (Witold's Data Consulting). https://witold1.github.io/portfolio/blog/viz-rulers-of-kazakh-khanate/.BibTeX
@misc{witold_blog_viz-rulers-of-kazakh-khanate,
  author = {Vitaliy Yevtushenko},
  title = {{Visualization "Rulers of the World" - Kazakh Khanate}},
  year = {2024},
  url = {https://witold1.github.io/portfolio/blog/viz-rulers-of-kazakh-khanate/},
}