Table of contents
Transcultural Empire (Peoplespace) explorer: map and table views over 1897 / 1926 census units
What is this about?
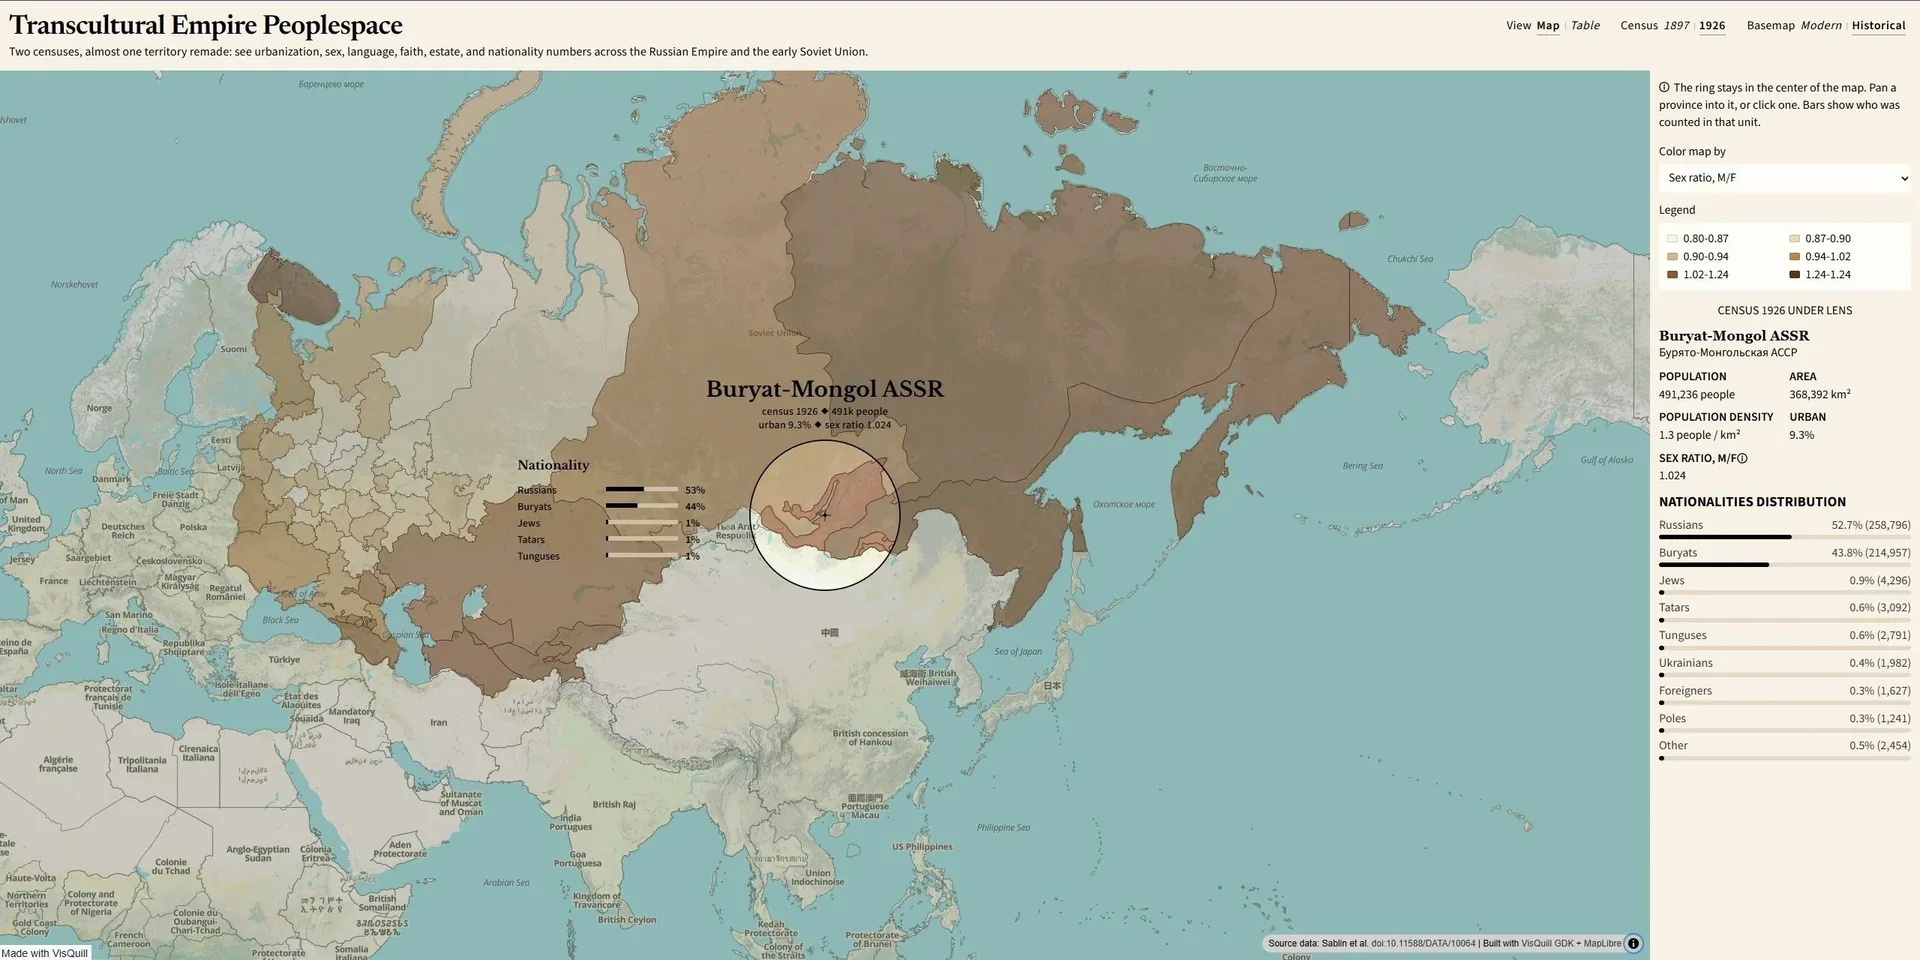
From Russian Empire subjects to Soviet citizens: this explorer puts the 1897 and 1926 censuses on one map and table surface so you can see how population, and the questions asked about people, changed across the regime break.
The Imperial census recorded social estate, native language, and religious affiliation. The Soviet census asked for self-declared nationality (narodnost) and native language (language is not in this extract). Administrative units and attribute fields therefore differ by year. The tool switches between them without pretending the two frames are the same.
How to read this?
Two views share the same year and basemap controls.
Map is a province choropleth with a fixed VisQuill lens, composition panels, and a side panel for the selected unit. Choropleth examples for 1897 include urban share, sex ratio, density, and top language or religion share. For 1926 they include total / urban / rural population, sex ratio, density, and top nationality share.
Data table lists the full DBF attributes for the active year (language, religion, estate, or nationality). Click a row to open that unit on the map.
The 1897 · 1926 toggle switches census year (about 99 units / ~126M people in 1897, of which 89 carry census attributes; about 67 units / ~149M in 1926). Modern · Historical switches the basemap: Historical defaults to OpenHistoricalMap dated to the selected census; Modern uses OpenFreeMap Liberty.
Why did I make it?
I wanted a single place to compare two censuses that sit on either side of 1917 without flattening their categories into one fake legend. Maps make the geographic break obvious. The table keeps the original attribute vocabulary visible, so methodology change stays part of the reading rather than a footnote.
What's under the hood?
The explorer is a Vite + TypeScript app (MapLibre, VisQuill). Python prep (pyshp, shapely) rebuilds data/processed/ GeoJSON, dictionaries, and tables from the Sablin et al. shapefiles (doi:10.11588/DATA/10064).
Open the interactive web tool. See the source code now on GitHub.
Related work
Census document guides by Yulia Novozhilova (1897) and for 1926. GIS backbone from Sablin et al. Further period context: Explanatory Notes (1926) and the List and Dictionary of Nationalities (1927) via Demoscope Weekly.
Media presence
No external mentions listed.
How to cite
For human-readable attribution, please cite this work as:
Visualization "Transcultural Empire Peoplespace" (2026), Vitaliy Yevtushenko (Witold's Data Consulting). https://witold1.github.io/portfolio/blog/viz-transcultural-empire-dataset/.BibTeX
@misc{witold_blog_viz-transcultural-empire-dataset,
  author = {Vitaliy Yevtushenko},
  title = {{Visualization "Transcultural Empire Peoplespace"}},
  year = {2026},
  url = {https://witold1.github.io/portfolio/blog/viz-transcultural-empire-dataset/},
}