⛁ Surnames navigator
• version: draft public • created: Mid-2024
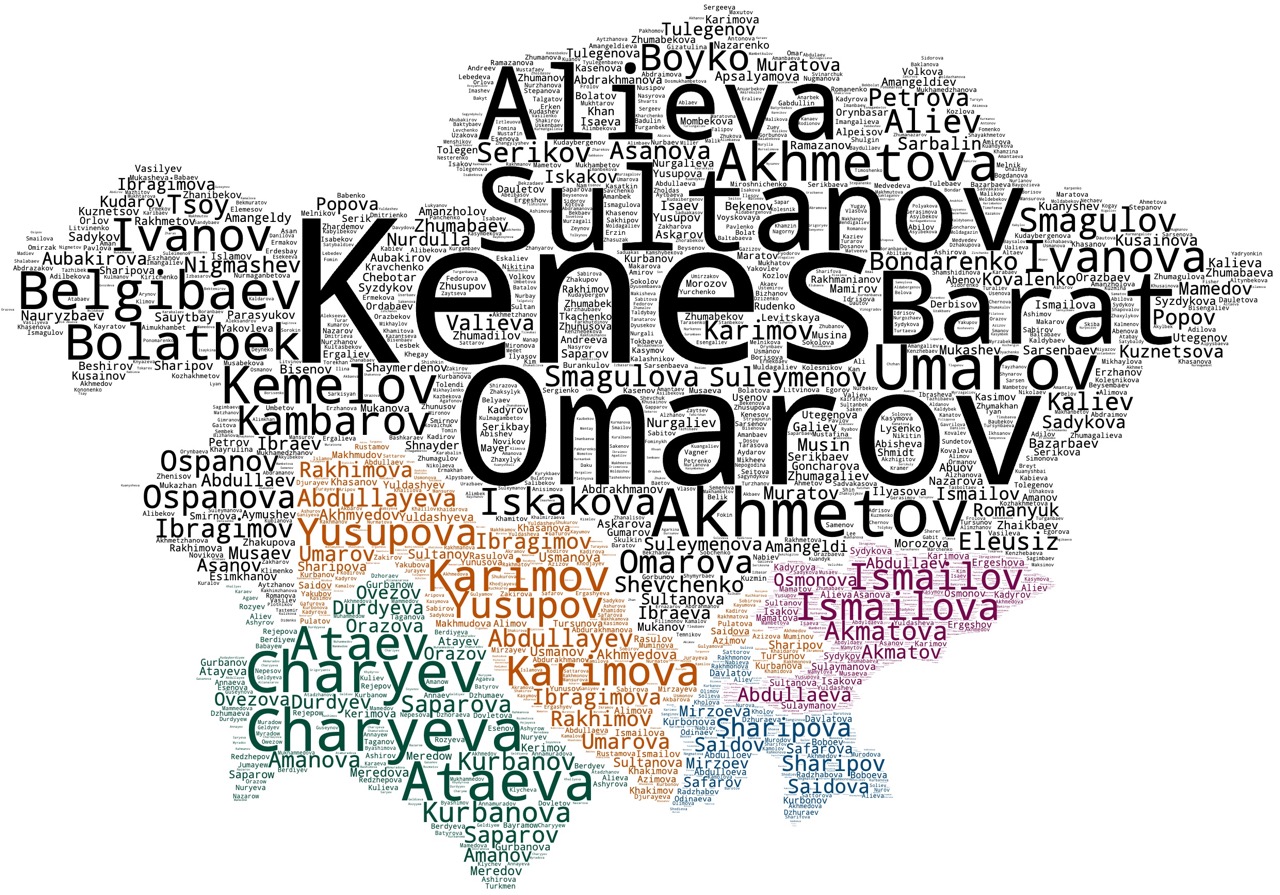
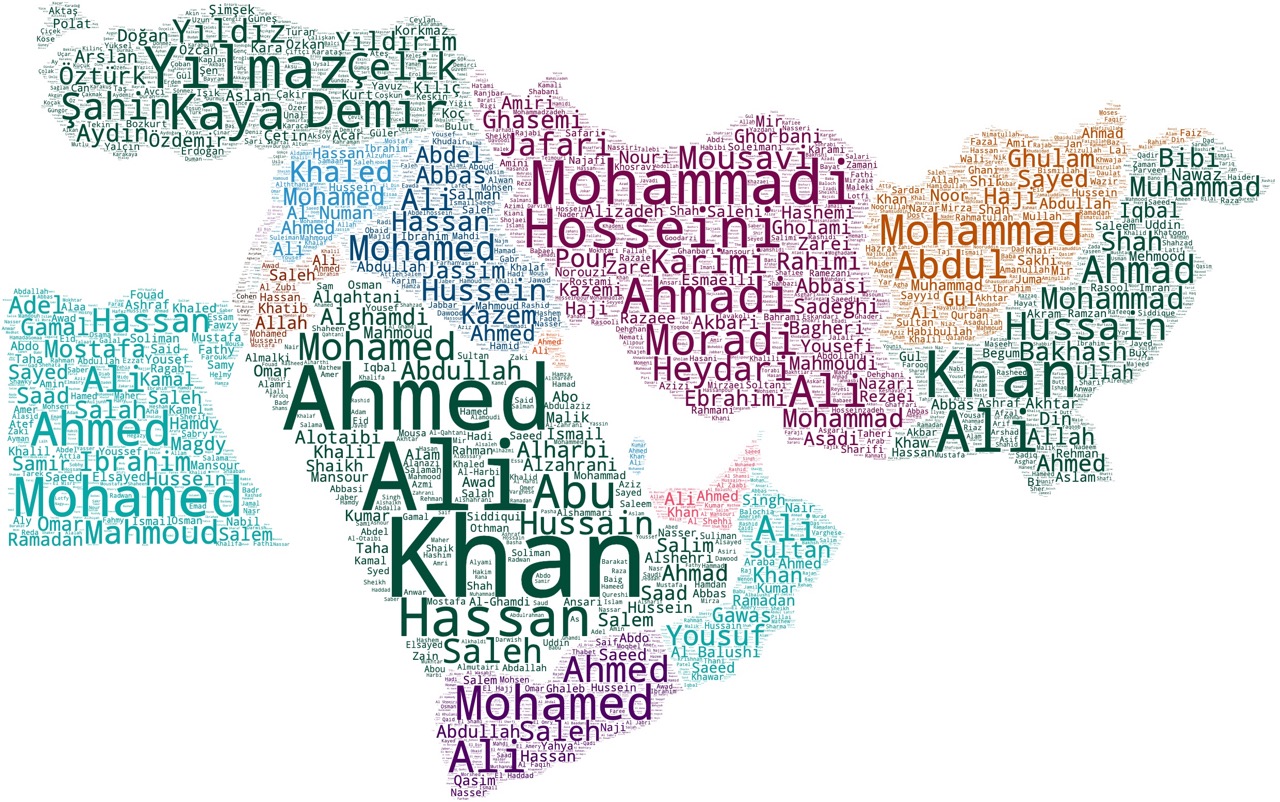
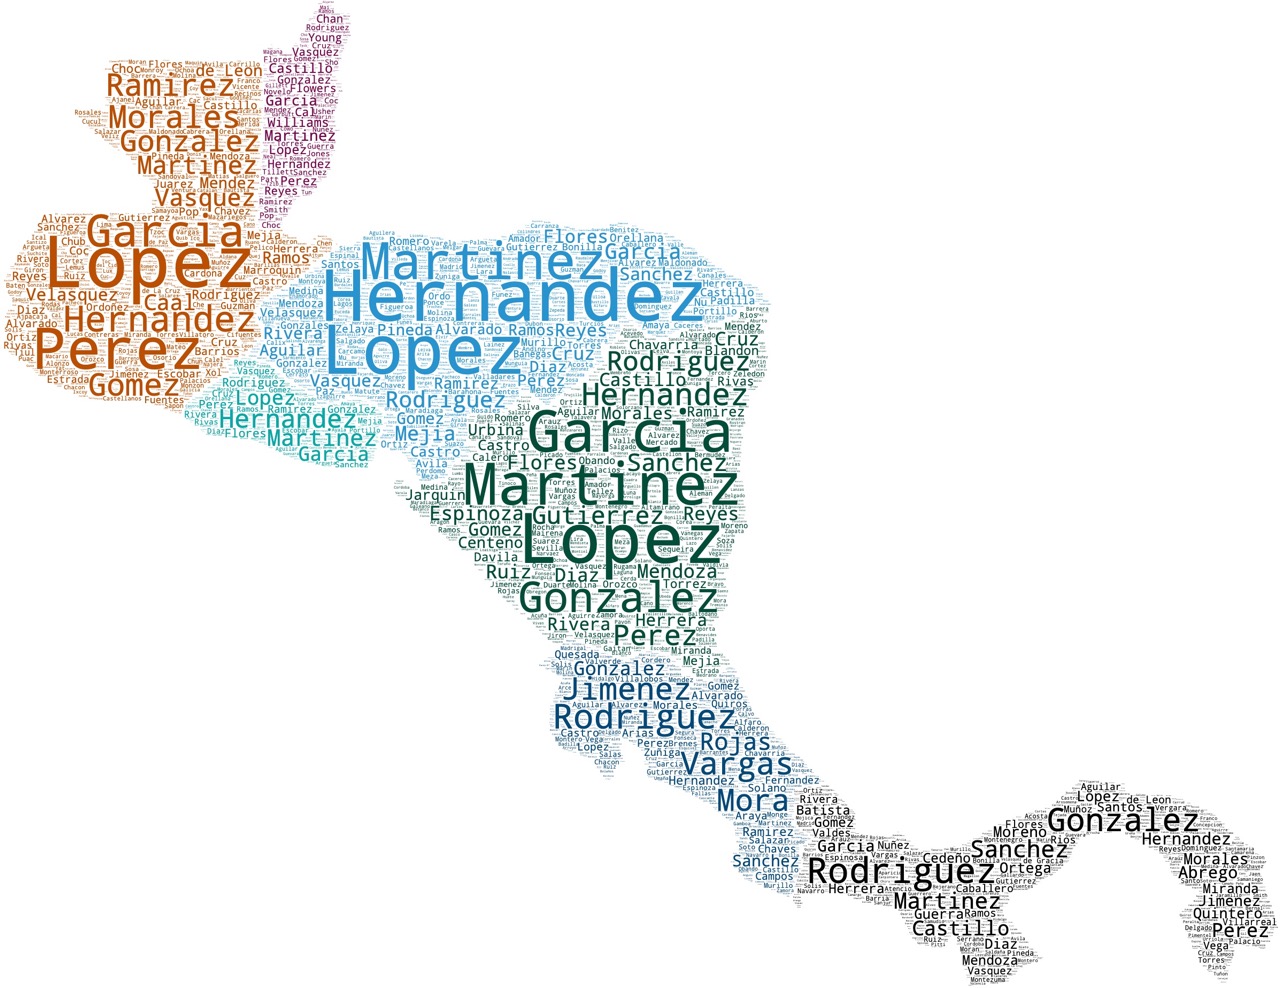
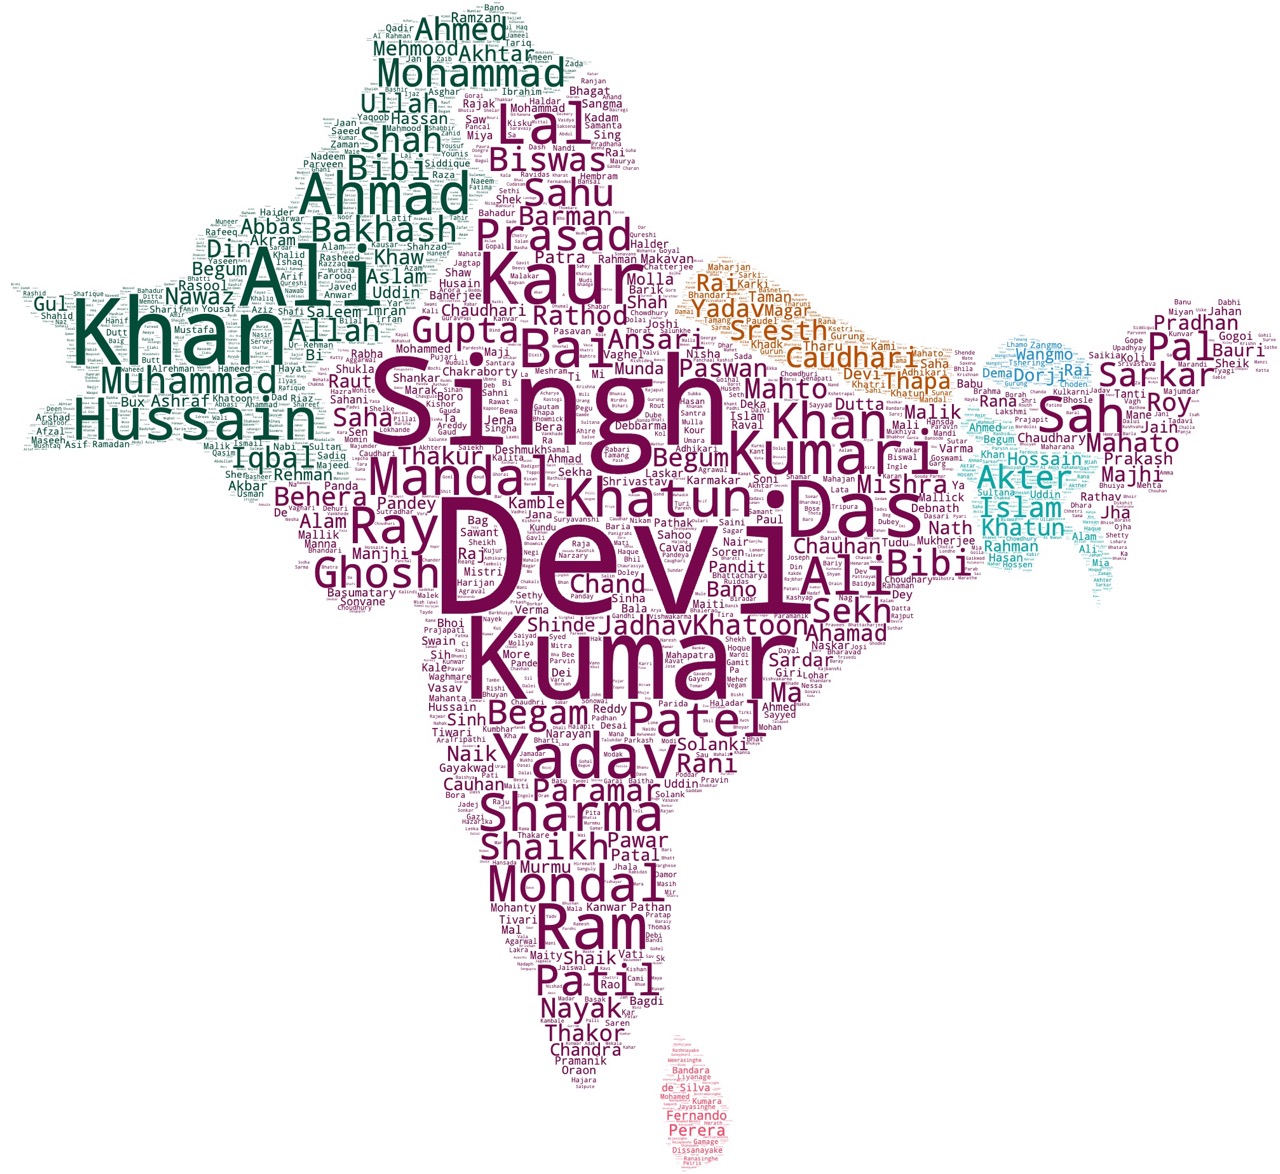
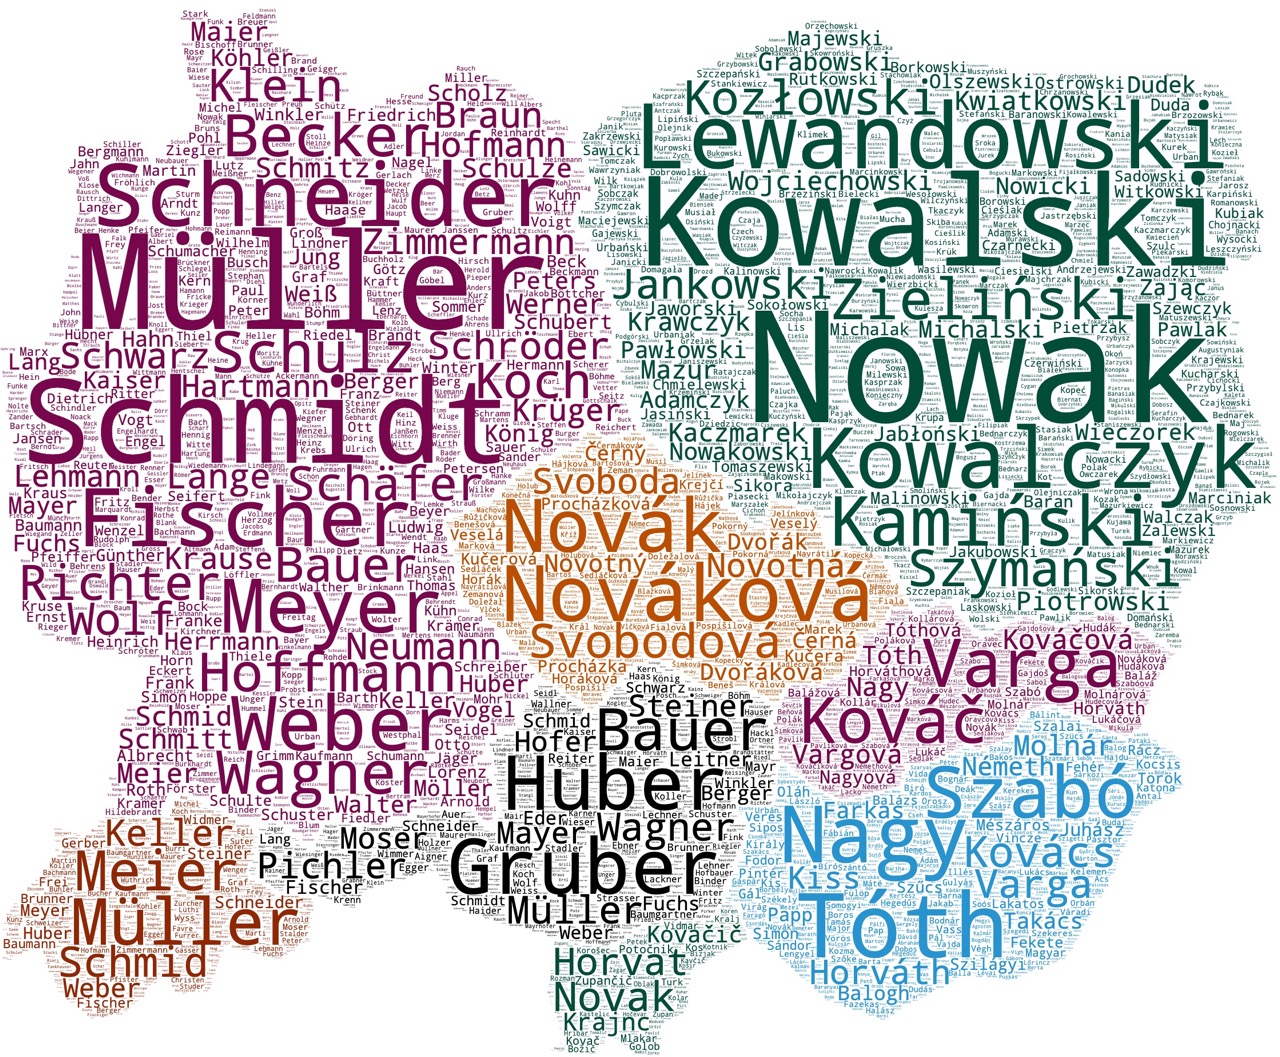
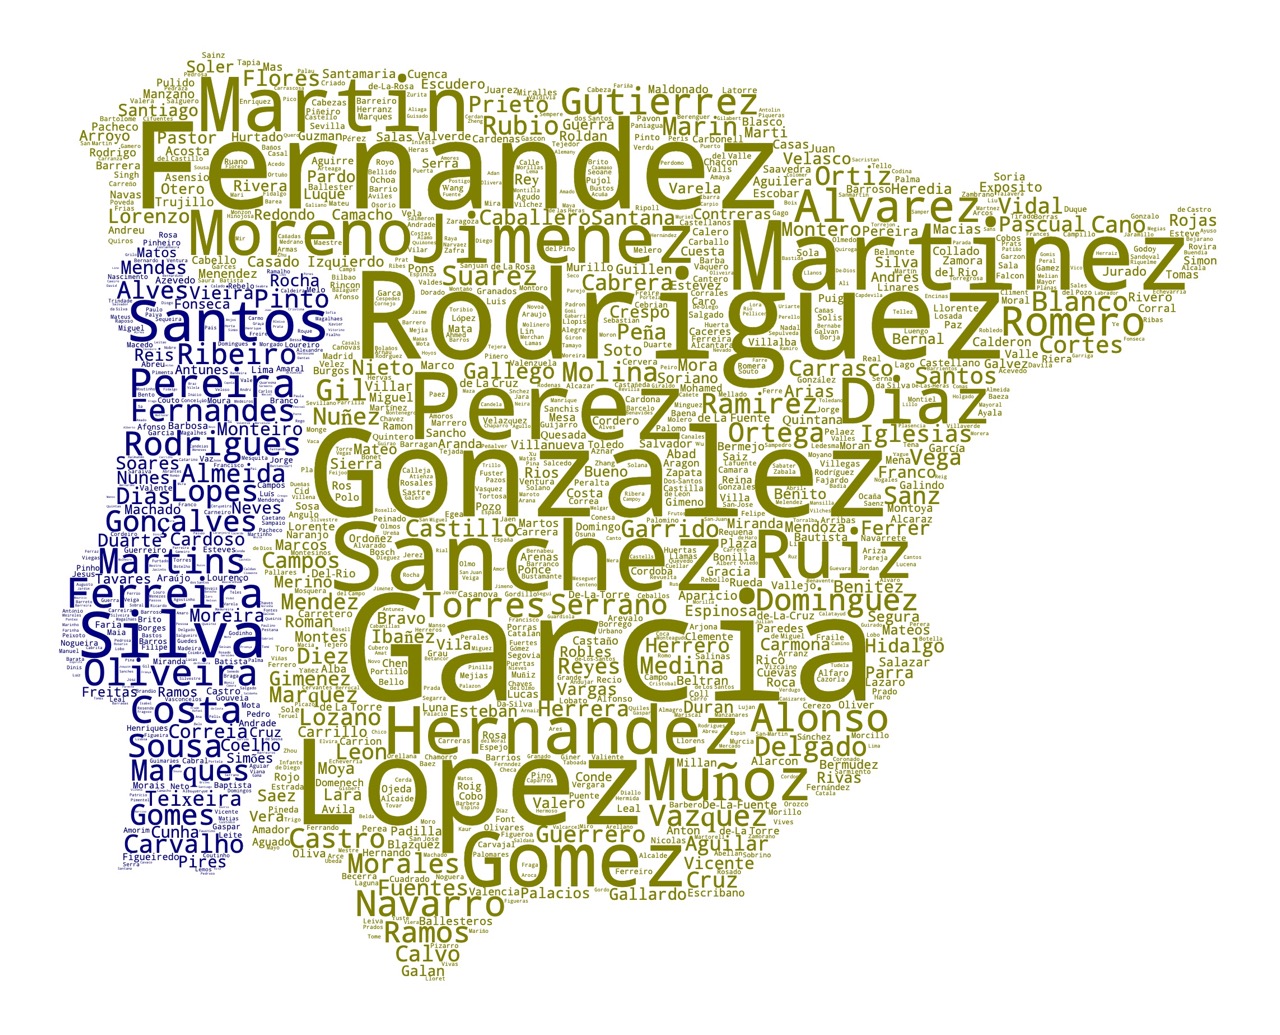
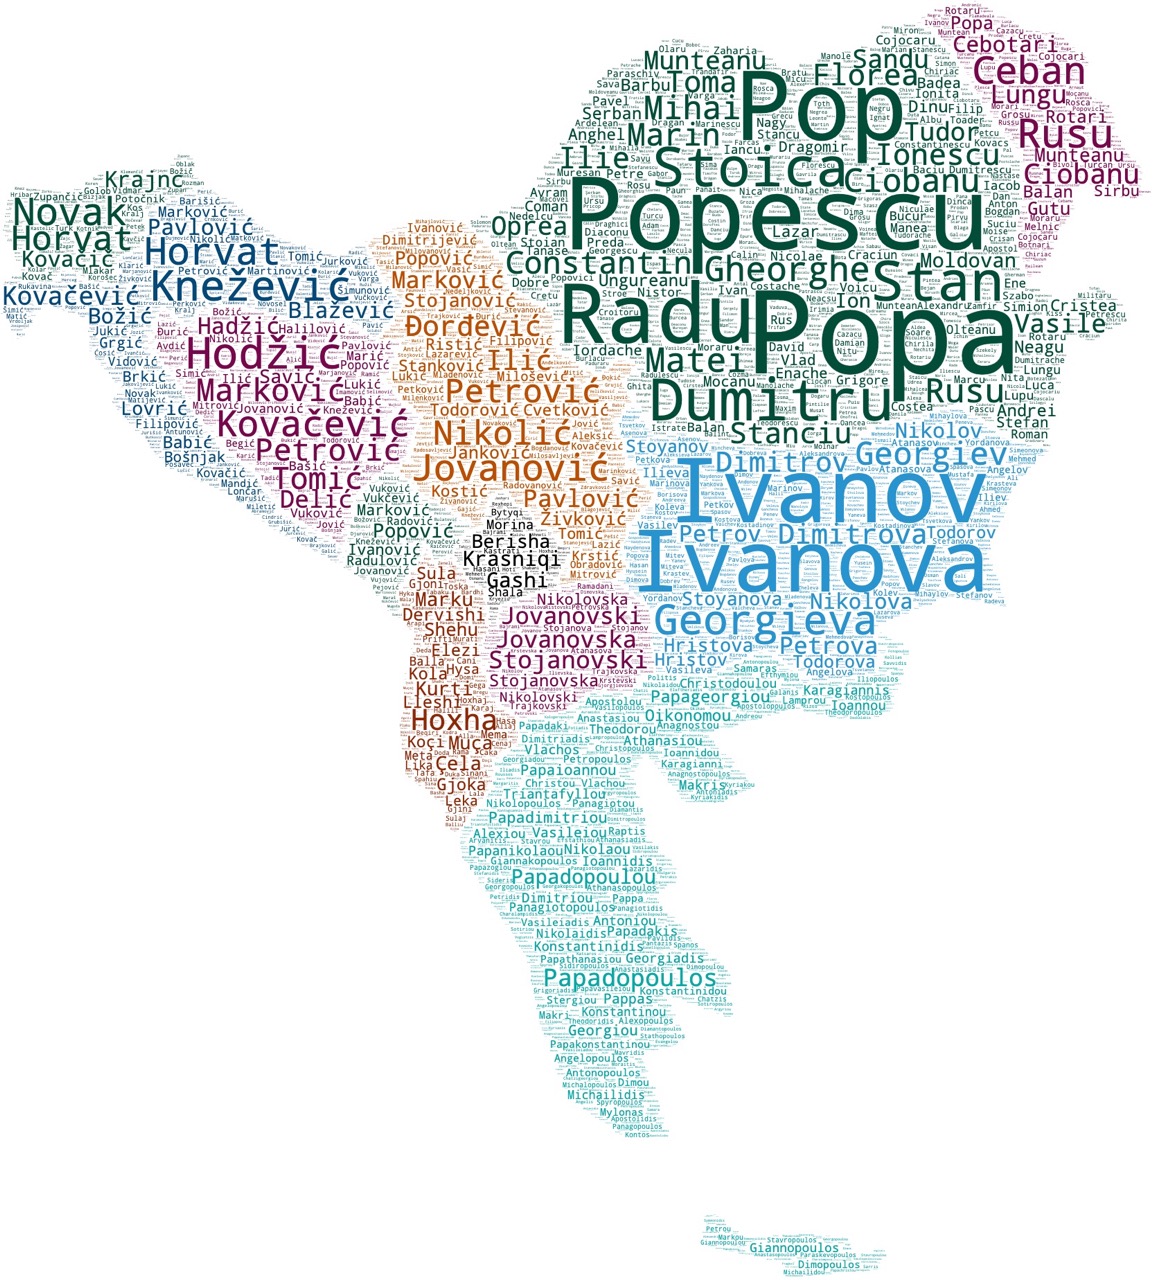
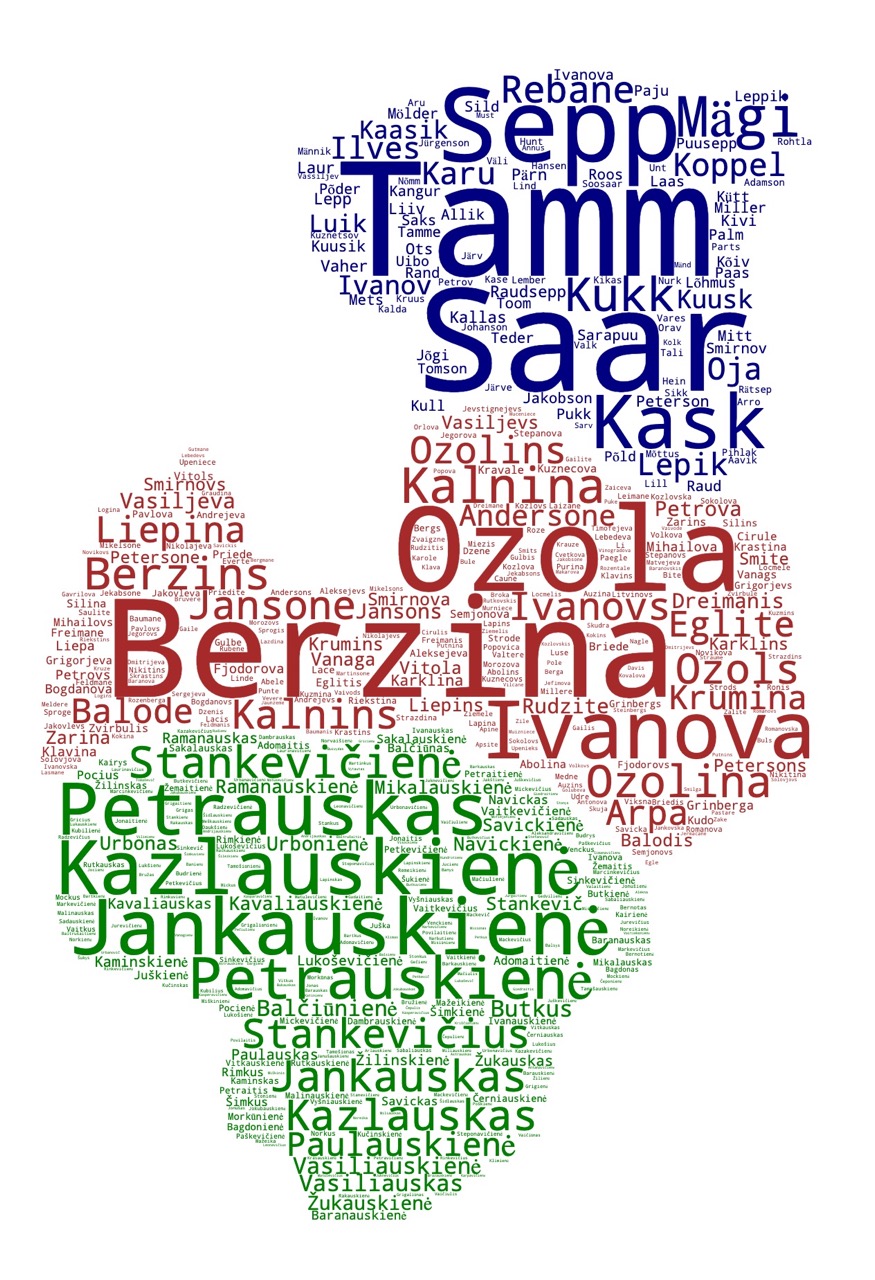
This is a meta-post to ease the navigation in surnames shown through "wordcloud" (a.k.a. tag cloud) visualisations across the regions of the world. Political boundaries shown according to their "de facto" status ⎋. Data came from Forebears.io§. ⇱ Click previews to open respective posts.
FAQ
Table of Content: How-to: Read this product • Methodology • Technical details •
💬 How-to: Read this product
Click here to read about how to understand this product.
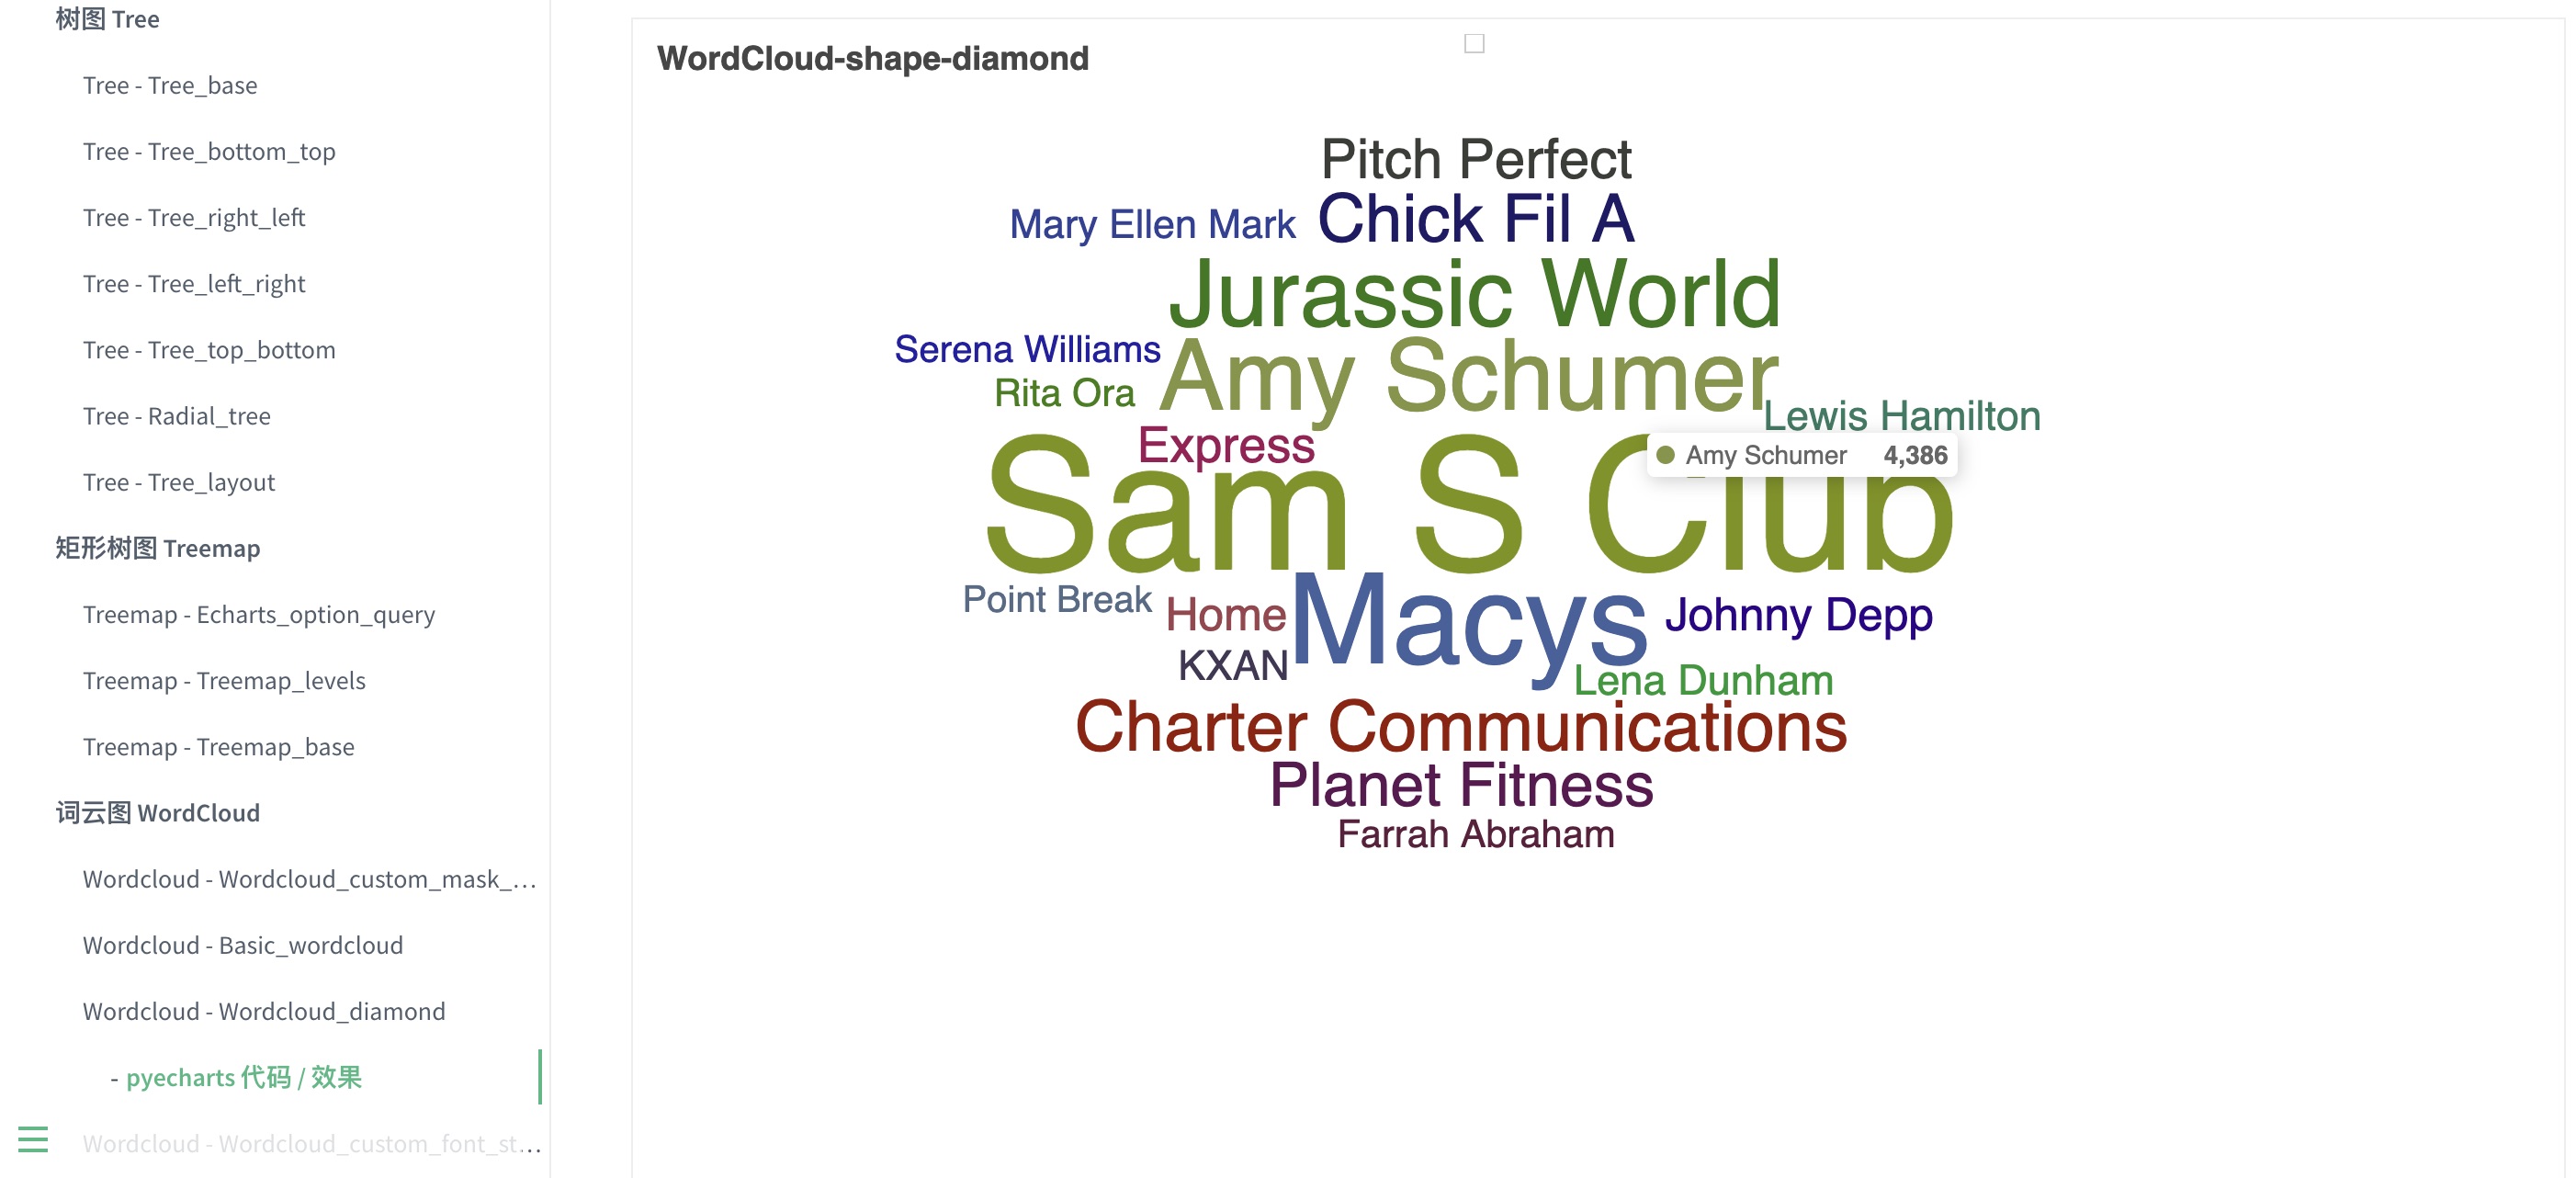
The bigger the "word" size, the more common the respective surname is. Databases of global surnames aggregated by admin units were used to access raw data on surname frequencies. Then, surnames were allocated within their respective admin units to create easier-to-read visuals in the form of "word clouds" (aka "tag clouds"). Below, (Fig. 1.1), one can see an interactive example with a random list of strings.
Fig. 1.1 Interactive wordcloud example (link), from ApacheECharts package.
Here is a historical article, from 2015 but now-archived, with dataset description - "Accuracy of Surname Statistics on Forebears" (https://forebears.io/news/accuracy-of-surname-statistics-on-forebears)
Additional sources: familysearch.org (https://www.familysearch.org/en/wiki/Europe) & its' "Naming_Customs" block (f.e., https://www.familysearch.org/en/wiki/Albania_Naming_Customs or https://www.familysearch.org/en/wiki/North_Macedonia_Naming_Customs) & ancestry.com (https://www.ancestry.com/name-origin?surname=popa)
🧮 Methodology details
Click here to read about methodology, data sources and limitations, possible use example.
- Data Source & Dataset Description
- Data Format & Columns
- References & Sources
Data Source & Dataset Description
Lorem ipsum dolor sit amet, consectetur adipiscing elit. Duis ac lorem nec felis maximus elementum a et ante. Pellentesque ultrices faucibus neque id fermentum. Donec elit risus, tincidunt vitae vehicula vitae, molestie non ex. Duis et elit a nisl scelerisque lacinia sit amet vitae nisl. Cras bibendum commodo orci eu tristique. Donec vestibulum ac enim vitae commodo. Duis quis posuere orci, tempus finibus justo. Nulla at ultricies ipsum. Sed efficitur eget tortor eget congue. Duis fermentum varius imperdiet. Aenean ante tellus, laoreet ac mollis vel, ultrices eu mauris. Morbi condimentum est sit amet neque sagittis, elementum varius neque faucibus. Suspendisse in quam at arcu pulvinar mollis eget vitae mi. Nunc egestas erat quis orci tincidunt scelerisque. Suspendisse efficitur nibh ut tellus posuere commodo.
Data Format & Columns
Lorem ipsum dolor sit amet, consectetur adipiscing elit. Duis ac lorem nec felis maximus elementum a et ante. Pellentesque ultrices faucibus neque id fermentum. Donec elit risus, tincidunt vitae vehicula vitae, molestie non ex. Duis et elit a nisl scelerisque lacinia sit amet vitae nisl. Cras bibendum commodo orci eu tristique. Donec vestibulum ac enim vitae commodo. Duis quis posuere orci, tempus finibus justo. Nulla at ultricies ipsum. Sed efficitur eget tortor eget congue. Duis fermentum varius imperdiet. Aenean ante tellus, laoreet ac mollis vel, ultrices eu mauris. Morbi condimentum est sit amet neque sagittis, elementum varius neque faucibus. Suspendisse in quam at arcu pulvinar mollis eget vitae mi. Nunc egestas erat quis orci tincidunt scelerisque. Suspendisse efficitur nibh ut tellus posuere commodo.
References & Sources
Fig. 2.1 "most common surnames in the Italian Regions [3508 × 4086]" by @medhelan, 2019.
![Reference - 'common surnames in the Italian Regions [3508 × 4086]', by @medhelan](https://i.redd.it/id6wvw9zxhdz.jpg)
Fig. 2.2 "Top 25 Surnames", National Geographic Magazine, 2011
(Oliver Uberti and Mina Liu-Derian [design team at NGM]; James Cheshire, Paul Longley, and Pablo Mateos [research from UCL Geography]).

& https://flowingdata.com/2011/01/27/map-united-states-of-surnames/
& https://mapdesign.icaci.org/2014/02/mapcarte-55365-whats-in-a-surname-by-oliver-uberti-and-mina-liu-2011/
& https://www.reddit.com/r/MapPorn/comments/1fhw48n/us_surname_distribution_by_region_color_coded_by/
& https://www.reddit.com/r/MapPorn/comments/r8seo/national_geographic_map_of_us_surnames_3214x2096/
& https://www.nationalgeographic.de/geschichte-und-kultur/kultur-die-herkunft-der-amerikaner
& https://jcheshire.com/featured-maps/whats-in-a-surname/ reviews and extensions by James Cheshire
★ Reference & source of inspiration for this navigator: menu from kontikimaps.com/how-old/cities
🛠️ Technical details
Click here to read about current ingestion pipeline, tools, and improvement steps.
Lorem ipsum dolor sit amet, consectetur adipiscing elit. Duis ac lorem nec felis maximus elementum a et ante. Pellentesque ultrices faucibus neque id fermentum. Donec elit risus, tincidunt vitae vehicula vitae, molestie non ex. Duis et elit a nisl scelerisque lacinia sit amet vitae nisl. Cras bibendum commodo orci eu tristique. Donec vestibulum ac enim vitae commodo. Duis quis posuere orci, tempus finibus justo. Nulla at ultricies ipsum. Sed efficitur eget tortor eget congue. Duis fermentum varius imperdiet. Aenean ante tellus, laoreet ac mollis vel, ultrices eu mauris. Morbi condimentum est sit amet neque sagittis, elementum varius neque faucibus. Suspendisse in quam at arcu pulvinar mollis eget vitae mi. Nunc egestas erat quis orci tincidunt scelerisque. Suspendisse efficitur nibh ut tellus posuere commodo.
Fig. 3.1 Processing graph (DAG).

Python is a programming language that lets you work quickly and integrate systems more effectively.
See: Python Documentation.
GeoPandas is an open source project to make working with geospatial data in python easier. GeoPandas extends the datatypes used by pandas to allow spatial operations on geometric types. Geometric operations are performed by shapely. Geopandas further depends on pyogrio for file access and matplotlib for plotting.
See: Geopandas Documentation.
Hamilton is a general-purpose framework to write dataflows using regular Python functions. At the core, each function defines a transformation and its parameters indicates its dependencies.
See: Hamilton Documentation.
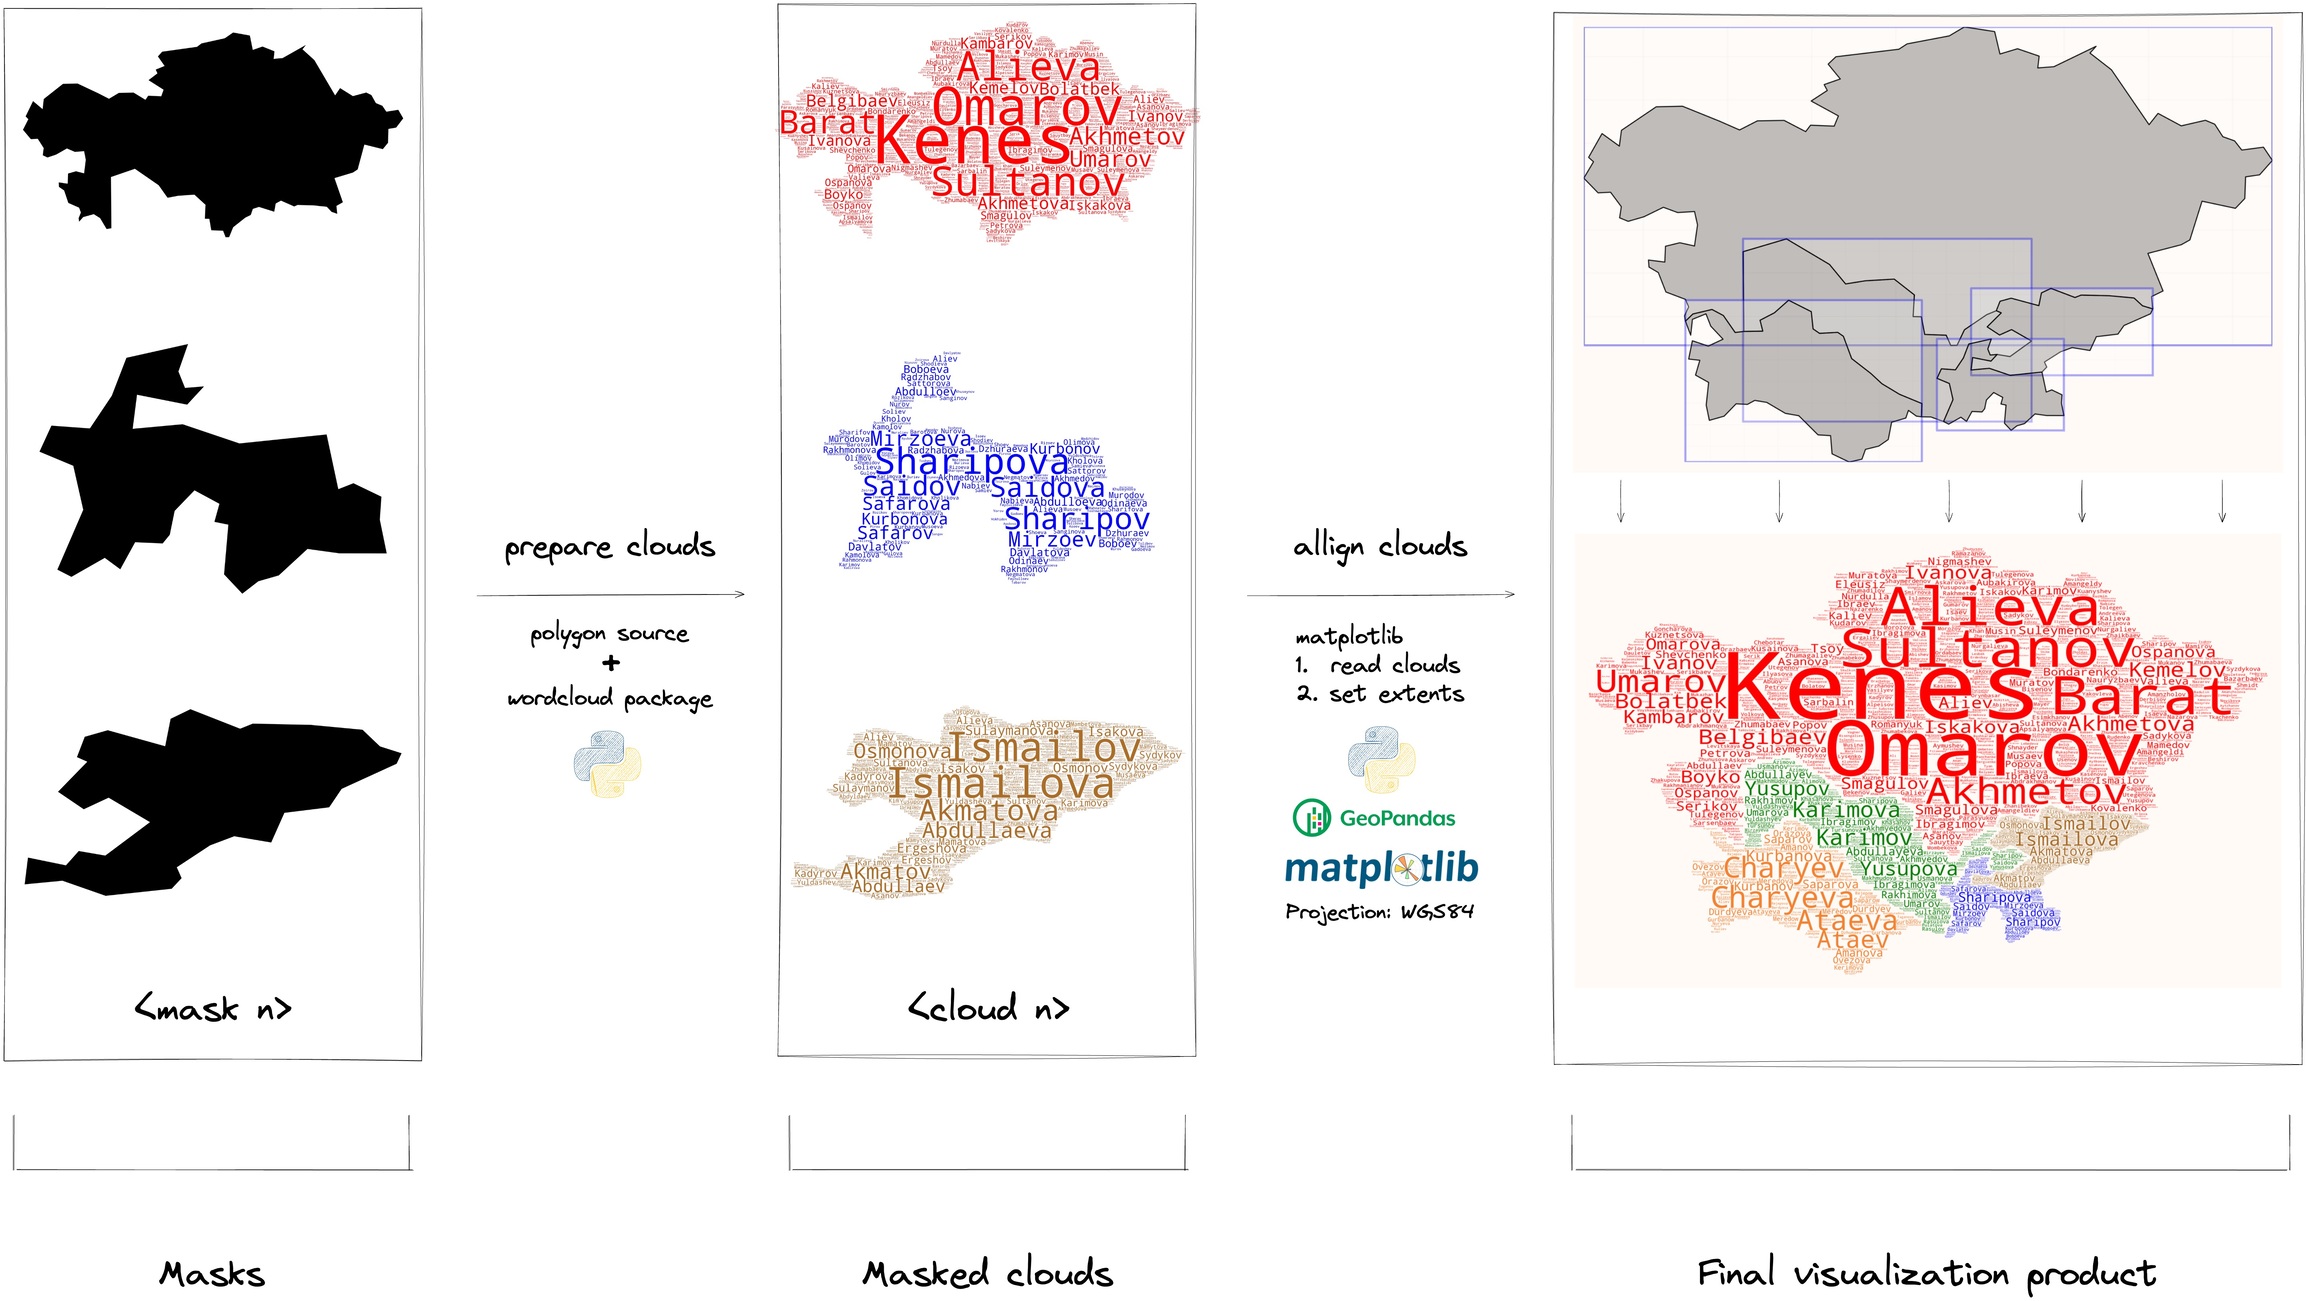
Fig. 3.2 High-level overview of pipeline, illustrated.
some description about "raster vs vector" formats, georeferencing in general and current geo-referencing for vector images
- Raster files are images built from pixels - tiny color squares that, in great quantity, can form highly detailed images such as photographs. The more pixels an image has, the higher quality it will be, and vice versa. The number of pixels in an image depends on the file type (for example, JPEG, GIF, or PNG).
- Vector files use mathematical equations, lines, and curves with fixed points on a grid to produce an image. There are no pixels in a vector file. A vector file’s mathematical formulas capture shape, border, and fill color to build an image. Because the mathematical formula recalibrates to any size, you can scale a vector image up or down without impacting its quality.
See: Raster vs Vector. What is the difference between raster and vector files?
Georeferencing or georegistration is a type of coordinate transformation that binds a digital raster image or vector database that represents a geographic space (usually a scanned map or aerial photograph) to a spatial reference system, thus locating the digital data in the real world.
See: Georeferencing.
📋 Next steps and TODO
Click here to read about analytical problems, next steps and futher TODO ideas.
What data and analytical problems and TO-DO are still here
- The data is still AS-IS. There is no lemmatization[1], normalization, or stemming. Regional customs, phonetically similar and gendered, are just different entities. Yet, we know we can apply a wide range of natural language processing techniques here
- Following the first point, the data source itself is unclear (how it collects, processes, and provides it, and how it has changed since the time of publication)
What UI-UX problems and TO-DO are still here?
- First of all... colors. It is not yet trivial for me to pick some "universal" palette and allocate it the way "similar" shades will not border each other, countries will be visually distinctive enough. However, it already looks like we would need six or seven relatively distinctive colors (countries routinely border five other countries). Yet, speaking of palette it looks like deep dark shades work better than bright. Also, the smaller the country area the darker color we need. Besides pure visuals, colors may encode some info (origin of surnames)
- Second of all... fonts. As with colors, we enter the plain typographical and design domain. Some units are big, some are small - usually, we would need serifed fonts for smaller and sansed for bigger. Moreover, python's `wordcloud` lib is rather inferior when we speak about fonts, you have to modify source code to embed Base64 with the whole TIFF of Droid Sans Mono
- Third of all... How to better merge, georeference, or in-other-way union word clouds to preserve displayed information, image quality, and optimize size. In an ideal world, we would need to geo-reference vector SVGs with the highest LOD possible, but now it isn't clear to me how to do it programmatically properly
- Fourth of all... interactivity. Openly available datasets are limited, and APIs to run any custom searches are paid. Yet, somehow we could implement search through the current SVGs we store and share.
- The last I would like to mention is... "auxiliary elements". At least, labels (names of admin units), title, source-citation-projection references. At max, more generic ones - labels of involved geo-features (waterbodies), small "locator" map, graticules, geo-tiles... Literally, to morph it into a proper geo/cartography product
★ NOTE: If you work with product where you may need to understand your customers and audinece deeper, please consider API from OnoGraph:Forebears.
The OnoGraph is a suite of services that predict characteristics of a person from their name. It can predict nationality, gender and location (where they live). Services for language and ethnicity are in development. The services are built on the largest private database of living people, encompassing over 4.25 billion people (as of July 2020). OnoGraph's results are the most accurate of any comparable service; and it recognizes around 40 million more names than the nearest comparable service.
See: OnoGraph Documentation & Introduction.
★ How to cite this work
Project "Surnames of " (2024), Vitaliy Y from Witold's Data Consulting
https://witold1.github.io/blog/posts/project-surnames-navigator/post