Ukraine's bloody tool
• version: public • created: Apr 2025
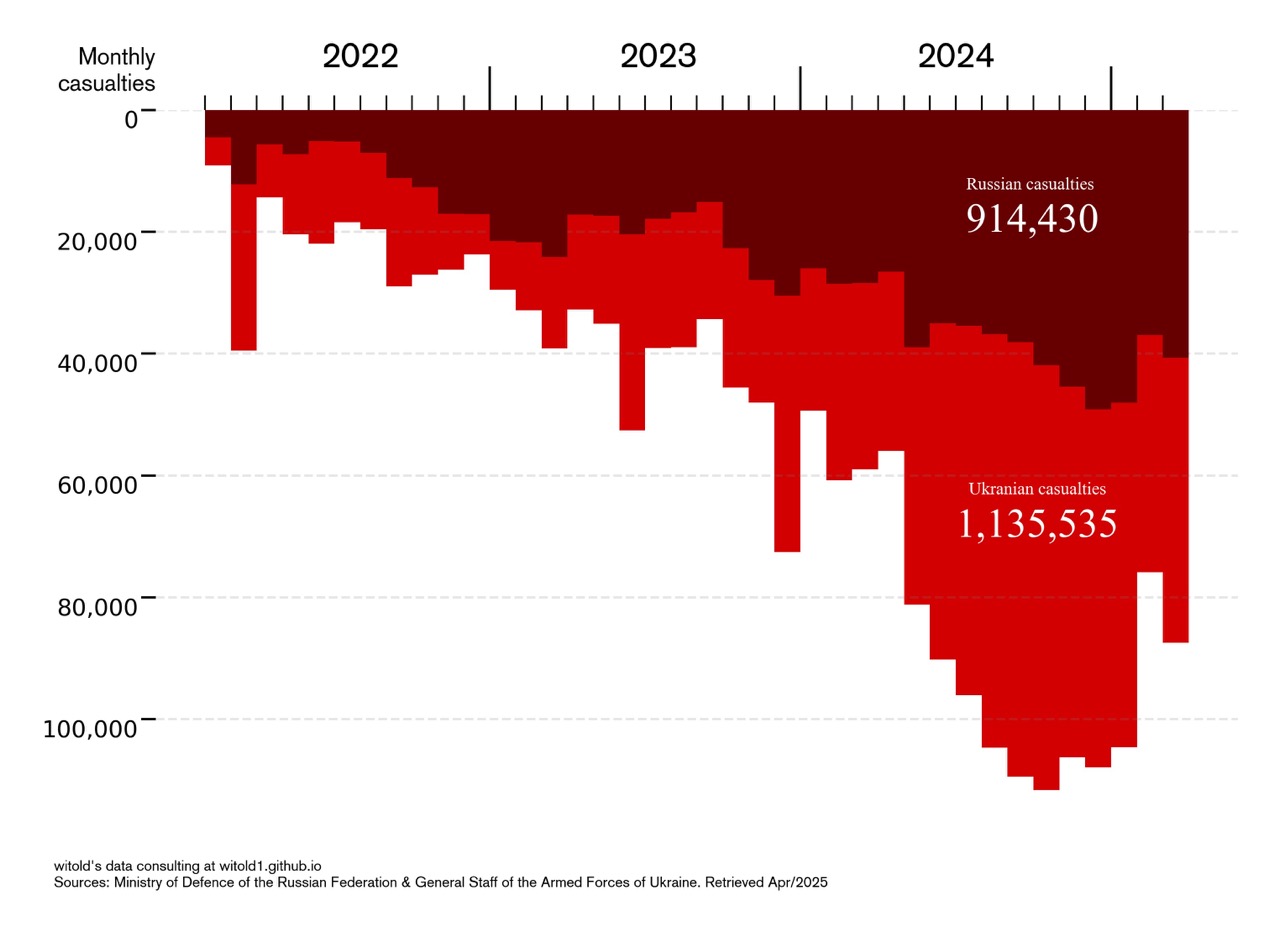
Fig 1.
Officially reported casualties in Russia-Ukraine war, since Feb 2022
⇱
Click preview image to enlarge in better quality
Introduction
Visualize official casualty reports from active stage of Russia-Ukraine war using PyData, Selenium and beautifulsoup4, and Grok 3 by xAI.
Here is a chart that illustrates casualty figures in current phase of Russia-Ukraine war, since 2022.
We see Russian-side casualties called by Ukrainian-side (in dark red), and Ukrainian-side casualties called by Russian-side (in light red), during ongoing military conflict. Information came from daily briefings held by adversaries military commands. Realistically, official data available is as doubtful as it could be, so this is a beautiful visualization of horrifying topic rather than an analytical product. Think of numbers as of extreme and distorted estimates of losses.
What's important here?
- These are "casualties" not "fatalities", or fatal casualties. According to American Battlefield Trust's “Civil War Casualties The Cost of War: Killed, Wounded, Captured, and Missing” article, a "casualty" is a military person lost through death, wounds, injury, sickness, internment, capture, or through being missing in action. In practice, officers would usually be responsible for recording casualties that occurred within their commands. One soldier could be marked as a casualty several times throughout the course of the war. Obviously, how armies report, process, and count this sensitive data may vary. For some domain example, see "How Israel Classifies its Wounded".
- This is "cross-reported". Means, Country 1 reports how many combatants Country 2 lost (killed, injured, surrended, etc.) in respective date, and vice-versa. Both adversaries don't share their own daily (or cumulative) casualties so freely. By many means, we can claim these numbers are nothing more than propaganda. But, this propaganda is official, direct and open. Other current or further research would work with alternative sources (including, but not limited to, measuring "excessive" death in whatever way, researching graveyard satellite images, counting inheritance cases, analyzing social networks, reading memoir and third-party reports, interviewing insighters or whistleblower, applying complex joint methodologies, quoting or criticizing each other), and someday will access archives with raw records.
- Trying to qualify, I would just write "a lot"; then it's up to involved entities to answer whether their vision of "a lot" justifies gains. Trying to quantify, personally, I would call a "ground truth" can easily lie within 25%-200% from cross-reported for any given figure. Participants are incentivized to mis-report about opponents to the public and there is no standardized public framework for how participants gather and classify both own and opponent casualties. Moreover, perhaps they are always evolving and changing their internal report accountability approaches over conflict.
- To advance into casualty figures, you may apply whatever "wounded-to-killed ratios" you think is reasonable for respective warfare. For example, "1:2:2", for "killed (died)" to "heavily wounded (to hospital)" to "lightly wounded (no medical attention needed)", respectively. However, at some extreme scenarios, with no regard to attrition ratios and assumption every casualty is unique, cross-reports share that around 1.3% of Russian and 5% of Ukrainian pre-war total male population was somehow directly injured from war that not yet.
How open and official data looks now?
- Russian reports: daily briefings with opponent losses reported by military command. Then there is non-official daily table with informaton extracterd from briefings by some media. See examples: Briefing of the Russian Ministry of Defense on April 16, 2022
- Ukrainian reports: daily tables with opponent losses shared by military command on their facebook page, also sometimes official briefings by military command with no personnel losses reported in briefings. Then, regional media copies it. See examples Operational information as of 08.00 09.04.2025 regarding the Russian invasion and The estimated total combat losses of the enemy from 24.02.22 to 09.04.25
- Once in a while, either side reports their own (and/or opponent's) cumulative losses outside of briefings. Media who publish non-official daily table who works with Russian-side briefinds wrote it accounts for them. Official tables by Ukrainian-side does not share how they count.
What methods and processing used?
- We parsed figures from aggregated tables avaliable on "МiнфiнМедiа" (minfin.com.ua) and "Время МСК" (mskvremya.ru). Both media says data comes from official cross-reports by their respective military commands.
- "Время МСК" was the only found media source that stores Russian-reported data for a full period. Moreover, their "media status" is shady (very new, few news besides table itself; will not surprise me if this media and website is AI-generated).
- "МiнфiнМедiа" was the most convenient to crawl found media source that stores Ukrainian-reported data for full period; because Ukrainian-side aggregated reports are much easier to get, there are tens of Ukrainian media who copy daily tables from military command page, but most of them does not store complete array.
-
To check data quality of these secondary-source tables,
- For "Время МСК" tables and Russian-side military command briefings, we collected a dataset of available primary-source daily briefings in unstructured texts format. Then, we used Grok 3 LLm to help us extract and normalize casualty information from briefings and matched it against respective aggregated table. For the first half-a-year of conflict, from 24.02.2022 to 30.06.2023, we got around 244,000 in secondary-source table to 176,000 losses in primary-source briefings, or ~30% overreporting with average exceeding equaled to 4,000 per month (with some peaks) and median exceeding equaled to 1,400 per month. However, in methodology section they noted: "The Russian Ministry of Defense periodically provides clarifications on the overall figures of killed and wounded Ukrainian Armed Forces militants <...> It is more correct to distribute clarification figures over the period specified in the clarification, but in this case there will be a discrepancy with the daily reports. For this reason, difference is added to the table on the day the relevant information is received". This note accounts for around 40K difference, or 204,400 in secondary-source table to 176,000 losses in primary-source briefings, or ~15% overreporting. At the same time, it did look that sometimes they distributed figures over time anyway. Also, I assume they forward filled some empty values in first month. Still, for this project I can accept 30% disparity (or more) with no issues.
- For "МiнфiнМедiа" and Ukrainian-side military command briefings, I did no computerized benchmarking. Ukrainian-side follows different communication format and itself reports daily tables in addition to briefings. Manual check showed that almost always secondary-source media just copy tables reported on facebook accounts of their military command with no modification, see "How open official data looks now?" above. If there are disparities, for this project I can accept it with no issues.
Dataset: collected dataset for project "Bloody tool" on google tables ⎋
Inspiration: "Iraq’s bloody toll" ⎋ by Simon Scarr ⎋
🏗️ How-to: Make this product
Dataset: collected dataset for project "Bloody tool" on google tables ⎋
Viz: I will share visualisation code
AI: Practically, in very natural and polite language I asked a chat model to help me extract some information from web pages.
- I explained the data (topic, where came from, cadence) and defined desired format (daily summary, with notes and summary table, also with notes). We worked some examples.
- It took extra time to make sure model extracts data from given files and does not use any prior knowledge (mostly, news saved in memory). Prior knowledge were the reason model "confidently lied" (it just generated something like it was trained with)
- It took extra time to make sure model use whole file (first, I attached each briefing, then I merged them into batches of five with length less than model's cutout).
- It took extra time to make sure model see what I need (sometimes model missed very explicit pieces of information). After a few "are you sure"-questions model found what it lost.
After I thought I got what I wanted, I tried to evaluate consistency of model so run the same basic prompts in six new sessions.
- Initial session. Model was surprisingly smart. After we worked things out (no internet, only process attached files, pay attention to details you miss), it was able to propoce output format I liked. It was able to improve output when data changed (f.e. offered to track cumulative uncertainties or to add additional columns). Overall, it was kinda "vibe exploratory analysis".
- Second session. Model worked so-so. We couldn't handle all gimmicks after the same prompts, then after additional prompts, then I stopped it.
- Third session. Model stalled and run into coding mode (offered some semantically wrong, oversimplified regular expressions that does not compile). I stopped.
- Fourth session. Right away model generated output format that I liked more than the first time. It provided smarter notes, better quotes. However, it complitely broke after I asked not to repeat some paragraphs each time to save window space. I couldn't get the initial format againn and stopped.
- Fifth, sixth, seven. Model worked so-so. Same prompts as initial one returned different output formats every time. Notes were so-so. Sometimes it shortened quotes in semantically wrong places. Sometimes it skipped paragraphs. Sometimes it accounted for wrong info and didn't want to correct it.
Media presence:
To be released soon
Table of Content:
Introduction •
★ How to cite this work
Visualization "Ukraine's bloody tool" (2025), Vitaliy Y from Witold's Data Consulting
https://witold1.github.io/blog/posts/small-project-blood-tool/post