Project "Rulers" - Kazakh Khanate
• version: public
• created: September 2024 / Қыркүйек 2024


Introduction
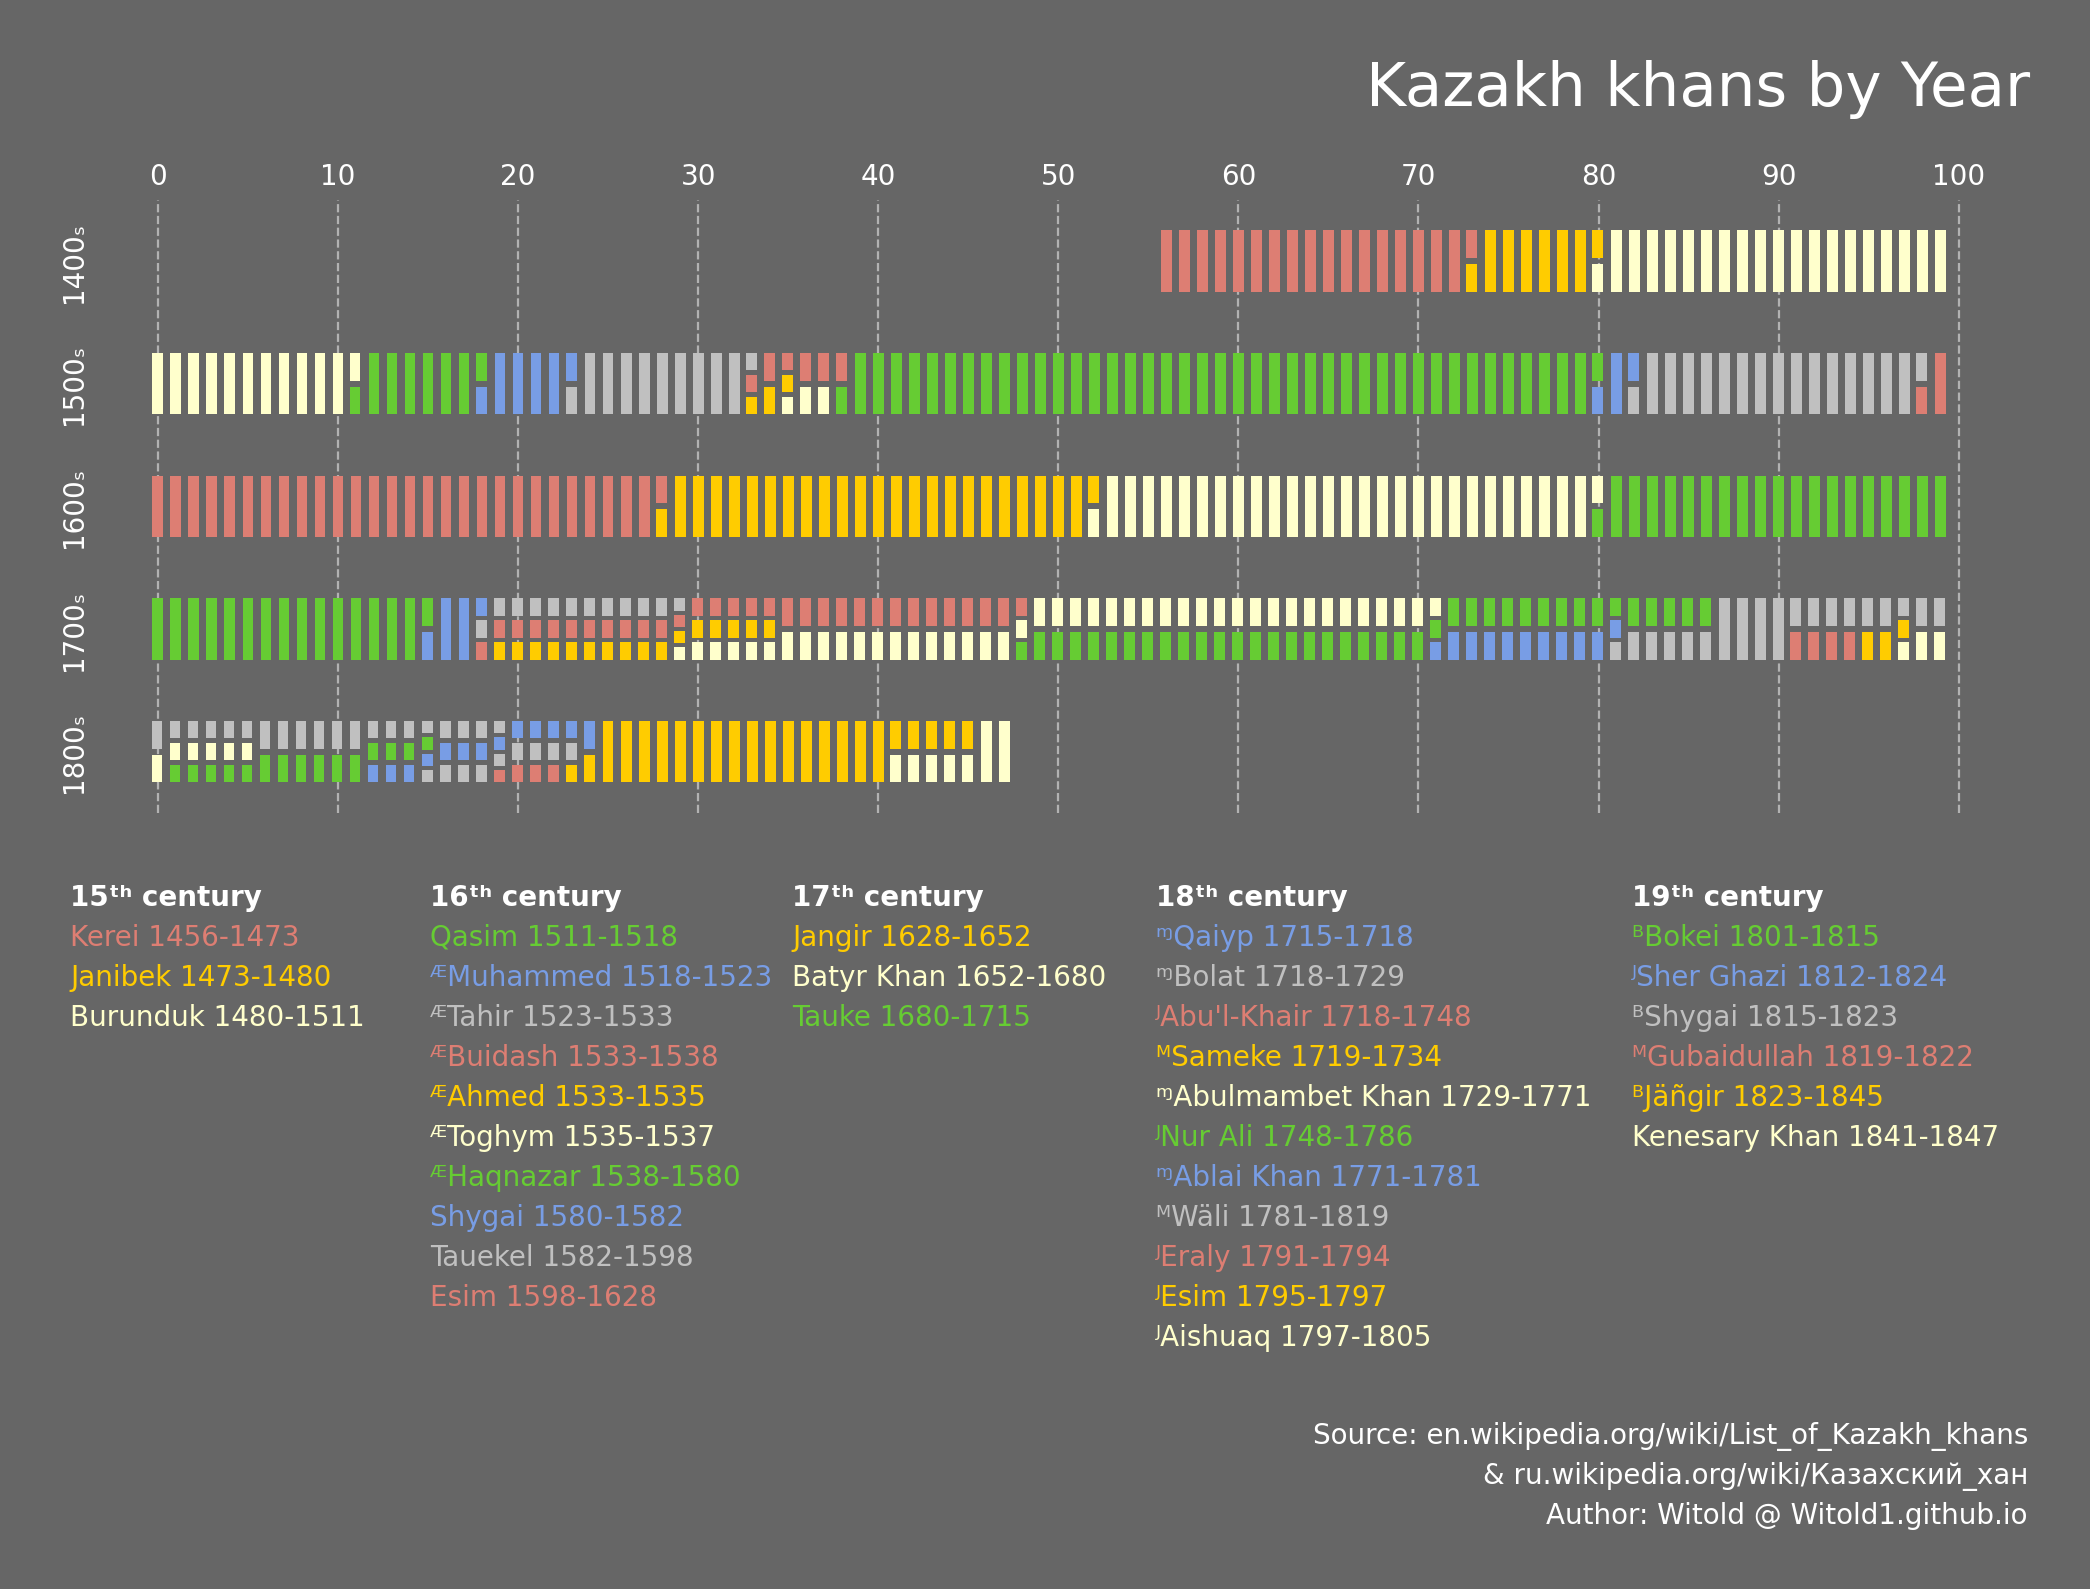
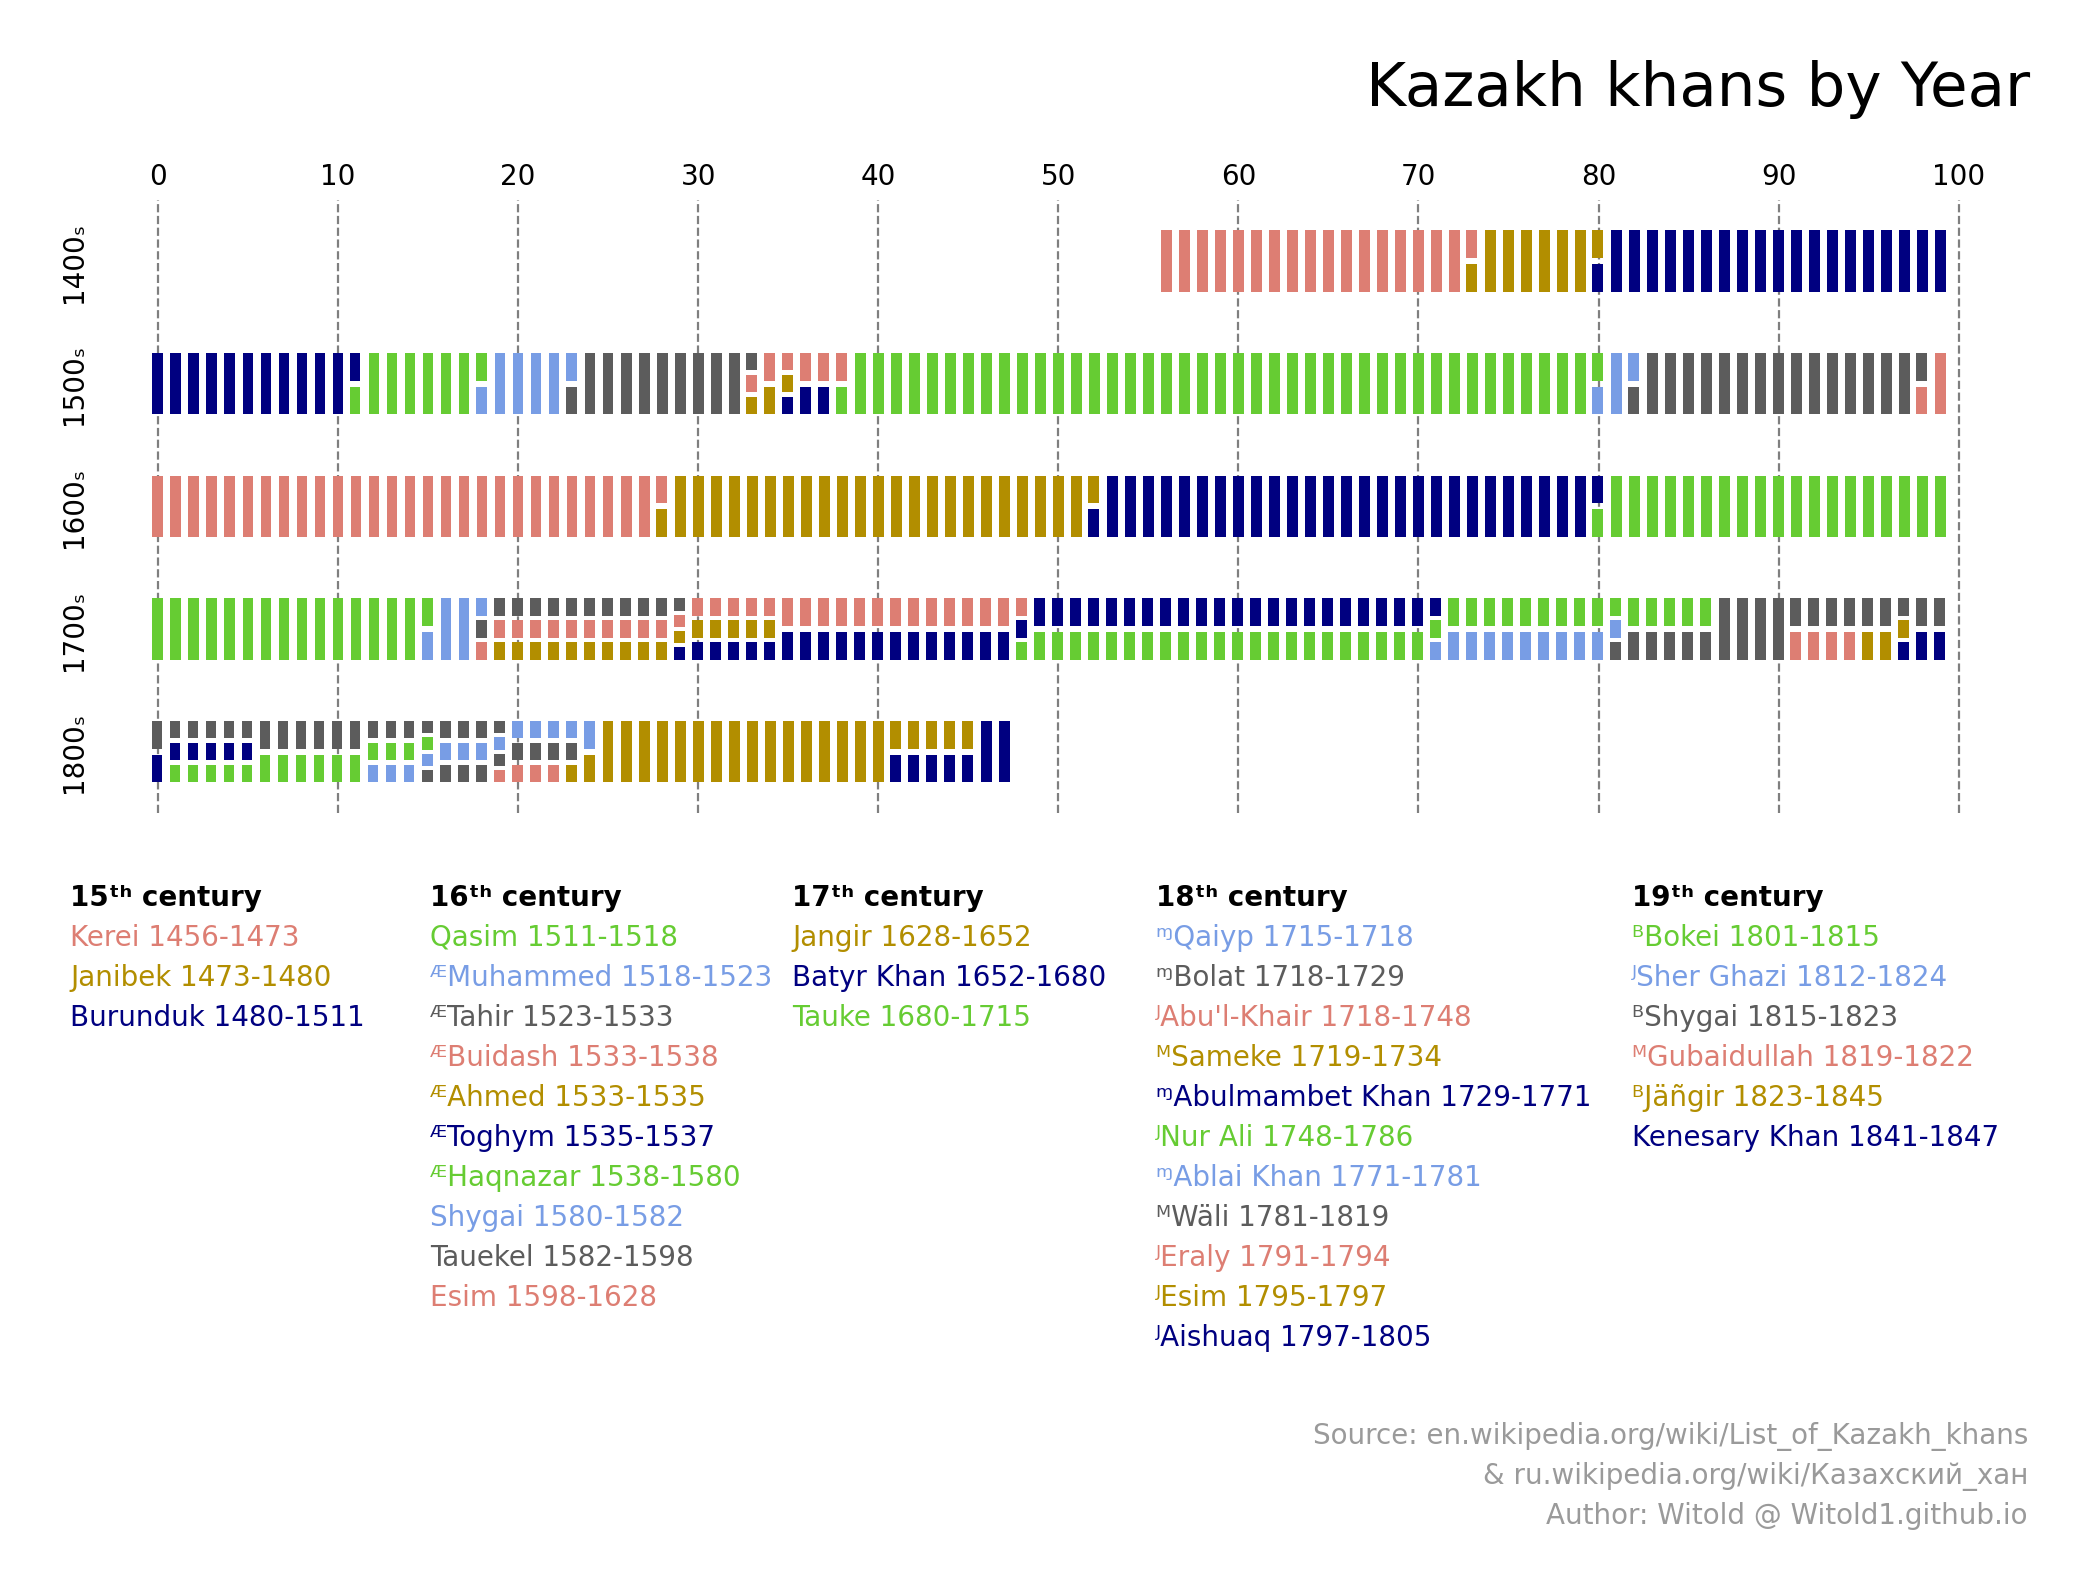
Recently I saw an old infographic visualization about Roman emperors prepared by Peter Gorman, from BarelyMaps for the #dataisbeautiful weekly contest on reddit. So, here is my version for rulers of the so-known Kazakh Khanate, a successor state of the Golden Horde in the region, in dark and white colors. Palette isn't web-safe or grayscale-safe. The reference chart by Peter is in comments. As usual, I reproduced it with pure #python and #matplotlib to make it scalable to other countries and historical periods (which one would you like to see?).
Chart type is... stripe chart?! Each stripe represents a year of the respective century. Solid stripes indicate there was only one ruler in that year, which presumes times of relative stability. Segmented stripe shows there were many rulers in that year, which usually signifies a vacuum of power, forms of split of power including co-rule, unrest, civil wars, or other forms of instability. Using the table below as a legend we can match each ruler with their respective colors and years of reign.
Inspiration: Roman Emperors by Year [OC] ⎋ by Peter Gorman from BarelyMaps ⎋
★ You can also check how the map of Kazakh Khanate was changing over time using " 카자흐 칸국 History of Kazakh Khanate (1459~1848)" ⎋ from Anwoo Mapping History ⎋, in English and Korean languages. Feel free to refer other animated maps if you know any.
Media presence: LinkedIn post ⎋ • "Data Visualization Picks / Sep 22, 2024" by BI Bites 🍪 ⎋ weekly news of dataviz and BI
Table of Content: Introduction •