Table of contents
Cars sorted by the share of American-made components
What is this about?
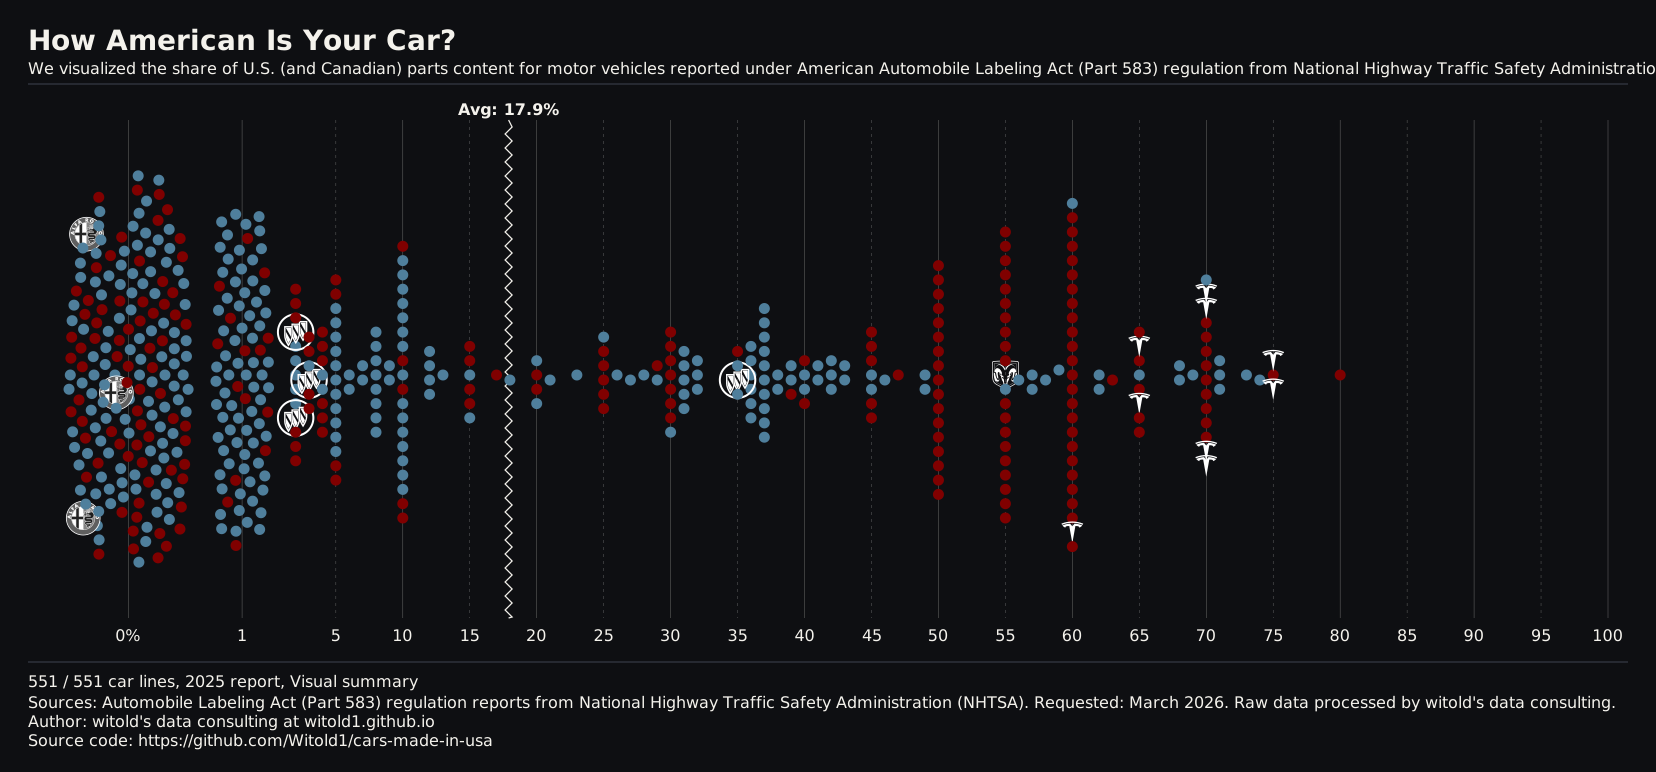
This project shows how carlines sit along a 0% to 100% scale of American (US/Canadian) component content. You can cut the same distribution by vehicle type, manufacturing corporation, and the region of those corporations. Coverage is limited to selected model years for now.
For the best experience, open it on a personal computer or laptop.
How to read this?
Each mark is a carline. Position along the axis is the reported share of American components. Filters reshape which carlines stay in view, so the same scale can answer different questions: which vehicle types cluster near fully domestic content, which corporations sit in the middle, and how regional ownership patterns look against the same axis.
Why did I make it?
Tariff debates often talk about "American-made" cars as if that were a binary label. I wanted a view that keeps the continuum visible: many vehicles are partly American by content, and the interesting story is where they fall between the extremes.
What's under the hood?
Open the interactive web tool. See the source code now on GitHub.
Related work
- Better Data Visualization Using Beeswarm Chart by Martin Heinz
- James Trimble, Dataviz at Office for National Statistics (UK) notebooks on Beeswarm, Jitter, and Histogram plots
- Ken Flerage's article on beeswarms in Tableau
Media presence
How to cite
For human-readable attribution, please cite this work as:
Project "Cars Made in USA" (2025), Vitaliy Yevtushenko (Witold's Data Consulting). https://witold1.github.io/portfolio/projects/project-cars-made-in-usa/.BibTeX
@misc{witold_projects_project-cars-made-in-usa,
  author = {Vitaliy Yevtushenko},
  title = {{Project "Cars Made in USA"}},
  year = {2025},
  url = {https://witold1.github.io/portfolio/projects/project-cars-made-in-usa/},
}